
What Are Fluorophores? A Practical Guide to Fluorescence Labels
Understand excitation, emission, brightness, photobleaching and spectral overlap before choosing a fluorophore for microscopy, flow cytometry or fluorescence assays.
Fluorophores are molecules or fluorescent materials that absorb light and release part of that energy as light at a different wavelength. Researchers use them to label cells, proteins, nucleic acids and other analytes. The useful signal is determined by the fluorophore, the label or probe design, the sample and the instrument together. A dye with a suitable color can still perform poorly if it is dim in the chosen optical setup, quenched by its environment or confused with autofluorescence.
- Choose the fluorophore from the instrument’s excitation sources and emission detectors, not from color names alone.
- Check brightness, spectral overlap, photostability, pH or environmental sensitivity and conjugate compatibility.
- Validate the signal with single-color, unlabeled and target-specific controls before interpreting a multiplex image or cytometry plot.
What a fluorophore does
A fluorophore, also called a fluorochrome when used as a fluorescent stain, has an electronic structure that can absorb photons at suitable wavelengths. Absorption raises the molecule to an excited electronic state. After energy is lost through molecular relaxation, the fluorophore can return toward its ground state by emitting a photon. The emitted photon usually has less energy and therefore a longer wavelength than the absorbed photon.1
The emitted light becomes a research signal only after it is collected by an optical system and converted by a detector. In immunofluorescence, the fluorophore may be attached to a primary or secondary antibody. In a fluorescent protein, the chromophore is formed within a genetically encoded protein. In a nucleic-acid or enzyme probe, the signal can depend on binding, cleavage, conformation or proximity. These designs should not be treated as interchangeable simply because they emit a similar color.
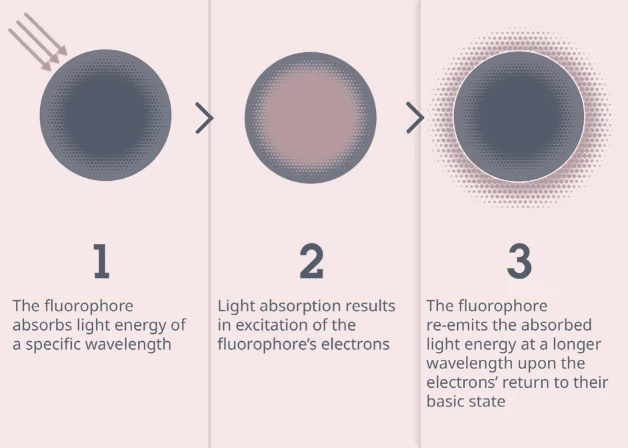
Excitation, emission and Stokes shift
An excitation spectrum describes how efficiently a fluorophore is excited as the illumination wavelength changes. An emission spectrum describes the wavelengths released after excitation. The maxima are useful reference points, but the full spectral curves matter because real lasers, lamps, filters and detectors have finite bandwidths.
| Term | Meaning | Why it matters experimentally |
|---|---|---|
| Excitation wavelength or maximum | Illumination wavelength that produces a strong excitation response under defined conditions. | The instrument must provide usable power at a compatible wavelength. A nominal laser line may excite several labels at once. |
| Emission wavelength or maximum | Wavelength region where emitted fluorescence is strongest after excitation. | Detector sensitivity, emission filters and neighboring labels determine how much signal is actually recorded. |
| Stokes shift | The separation between the excitation and emission bands, commonly described by their maxima. | A larger shift can make excitation light easier to reject, but it does not by itself guarantee a brighter or cleaner measurement. |
| Fluorescence spectrum | The combined excitation and emission behavior of a fluorophore under specified solvent, pH, binding and instrument conditions. | Spectra can shift or change shape with environment, concentration, aggregation or chemical modification. |
Do not select a label from a single peak value alone. Compare the fluorophore’s complete spectra with the instrument’s light sources, filters or detector array, and with the spectra of all other labels in the experiment.
For example, fluorescein isothiocyanate (FITC) is a commonly used fluorescein-derived label. Its practical signal depends on the excitation source, filter set, pH, conjugation and sample background, so the name “FITC” is not a substitute for checking the final optical configuration.
Properties that control signal quality
| Property | What it describes | Selection and interpretation note |
|---|---|---|
| Molar extinction coefficient | How strongly a species absorbs light at a defined wavelength and condition. | Higher absorption can support more excitation, but detector sensitivity, labeling density and local environment also determine the measured signal. |
| Fluorescence quantum yield | The fraction of absorbed photons that are emitted as fluorescence. | Useful for comparing probes under comparable conditions. It can change with solvent, pH, oxygen, binding and conjugation. |
| Brightness | Often approximated as extinction coefficient multiplied by quantum yield. | This is a photophysical comparison, not a guarantee of image intensity. Optical throughput, probe concentration and background still matter.6 |
| Photostability | Resistance to irreversible loss of fluorescence during illumination. | Important for long exposures, repeated imaging, tracking and super-resolution. Oxygen, illumination power and mounting medium can alter bleaching. |
| Dark states and blinking | Transient non-emissive states or intermittent emission. | Can be useful for single-molecule or super-resolution methods, but can also look like unstable labeling or particle loss. |
| Environmental sensitivity | Dependence on pH, polarity, viscosity, ions, binding or local quenching groups. | Environmental probes exploit these changes; ordinary labels should be checked for them when comparing compartments or fixation conditions. |
| Size and conjugation behavior | Physical size, charge, linker, labeling ratio and effect on the target reagent. | A bright label can disrupt antibody affinity, protein trafficking or molecular diffusion if the conjugate is poorly designed. |
Photobleaching is a photochemical process, not simply “running out of dye.” It can involve oxygen-dependent and oxygen-independent pathways and depends on fluorophore structure, medium and illumination. Anti-fade conditions reduce some losses but can also change cell physiology or probe behavior, so they should be validated for the experiment.2
Main fluorophore classes
| Class | Typical use | Strengths | Trade-offs |
|---|---|---|---|
| Small organic dyes | Antibody conjugates, nucleic-acid stains, enzyme substrates and chemical probes. | Broad color selection, compact size and flexible chemical modification. | Photobleaching, concentration quenching, environmental sensitivity and variable conjugation can limit performance. |
| Fluorescent proteins | Genetically encoded reporters, fusion proteins, biosensors and live-cell tracking. | Can be expressed in living cells and targeted by genetic design. | Maturation time, oligomerization, pH sensitivity, photostability and fusion effects vary among proteins.6, 7 |
| Phycobiliproteins and protein-based labels | High-sensitivity antibody or cytometry reagents. | High absorption cross-section and strong emission can support bright staining. | Large size, tandem-dye stability and instrument-specific spillover require validation. |
| Quantum dots | Longer-duration imaging, multiplexed probes and specialized in-vitro or in-vivo assays. | Broad excitation, narrow size-tunable emission and high photostability are useful for some multiplex designs. | Surface chemistry, blinking, size, nonspecific interactions and material composition affect biological use. Toxicity and containment must be assessed for the specific material.8 |
| Fluorogenic probes | Signals that increase after binding, cleavage, enzymatic activation or dequenching. | Can reduce background when the unreacted probe is weakly fluorescent. | Signal depends on reaction kinetics, probe access, substrate turnover and off-target chemistry. |
“Fluorescent” does not mean “intrinsically quantitative.” Quantification requires a calibrated relationship between the measured signal and the target quantity, with controls for probe concentration, instrument response, background and saturation.
Choosing labels by application
| Application | Primary selection question | Important checks |
|---|---|---|
| Widefield, confocal or light-sheet microscopy | Can the label be excited and collected efficiently while preserving spatial detail? | Filter sets, laser power, optical sectioning, autofluorescence, photobleaching and pixel saturation. |
| Flow cytometry | Can the fluorophore be resolved by this instrument after spillover correction or spectral unmixing? | Laser lines, detector filters, single-stain controls, spreading error, tandem-dye stability and antigen density.9 |
| Plate-reader assay | Does the reader support the excitation and emission bands with a linear dynamic range? | Well geometry, optical path, inner-filter effects, concentration quenching, gain, standard curve and blank subtraction. |
| Live-cell imaging | Will the label and illumination preserve cell viability and target behavior? | Expression or delivery burden, phototoxicity, maturation time, medium compatibility and imaging interval. |
| FRET | Does the donor–acceptor pair have suitable spectral overlap and distance sensitivity? | Donor-only, acceptor-only and non-interacting controls, donor bleed-through, direct acceptor excitation and probe stoichiometry.4 |
| FLIM or time-resolved fluorescence | Does the probe’s lifetime and decay behavior match the instrument and analysis model? | Instrument response, photon counts, lifetime calibration, multi-exponential fits and environmental dependence.5 |
For FRET, spectral overlap is necessary but not sufficient. Energy transfer depends strongly on donor–acceptor distance and orientation as well as the donor quantum yield and the refractive environment. A FRET change should therefore be tested against donor-only, acceptor-only and negative-interaction controls rather than inferred from color proximity.
Multiplexing and spectral overlap
Fluorescence spectra are broad enough that one label can be detected in more than one channel. In conventional flow cytometry, compensation estimates spillover between detectors. In spectral cytometry or spectral microscopy, unmixing separates measured signals using reference spectra. Neither correction can recover information that was not captured or distinguish labels whose signals are not sufficiently different under the actual instrument and sample conditions.3, 9
| Multiplex issue | Observable symptom | First check |
|---|---|---|
| Spectral spillover | A bright single-positive population appears shifted in neighboring channels. | Run a single-stain control using the same fluorophore, conjugate or bead material and instrument settings. |
| Spreading error | Negative and dim populations become harder to separate after compensation. | Reconsider fluorophore placement, antigen density and the brightness of neighboring labels; compensation does not remove variance introduced by spillover. |
| Autofluorescence | Unlabeled sample signal is broad, tissue-dependent or strongest in particular channels. | Acquire an otherwise identical unlabeled sample and include it in the analysis or unmixing model. |
| Bleed-through or channel cross-talk | Signal from one imaging channel appears in another or creates false co-localization. | Image single-label controls with the final optics and acquisition settings; adjust filters, sequential acquisition or unmixing. |
| Detector saturation | Bright pixels or events are clipped and no longer proportional to signal. | Lower exposure, gain or illumination and repeat within the detector’s linear range. |
Multiplex panel design is instrument-specific. A web spectrum chart can help shortlist candidates, but it cannot replace single-color controls and an empirical check of the final panel.
Controls and troubleshooting
Include controls that isolate different error sources. An unlabeled sample measures autofluorescence and other sample background. A no-primary or secondary-only control tests antibody-related background in an immunofluorescence workflow. Single-color controls estimate spillover or reference spectra. A target-negative, knockout, competition or known-positive control addresses specificity, depending on the assay.
| Observation | Possible explanations | Check next |
|---|---|---|
| Weak signal | Low target abundance, poor labeling, inaccessible epitope, low excitation, photobleaching or quenching. | Check label integrity, target-positive control, optical settings, exposure linearity and sample preparation. |
| High background | Autofluorescence, nonspecific binding, unremoved free dye, excessive concentration or out-of-band detection. | Compare unlabeled and no-primary controls, titrate the reagent, wash or purify the conjugate and inspect the optical configuration. |
| Unexpected channel signal | Spillover, tandem-dye degradation, direct excitation, spectral shift or detector cross-talk. | Repeat single-color controls under final conditions and recalculate compensation or unmixing. |
| Signal changes over time | Photobleaching, blinking, probe maturation, binding kinetics, cell movement or environmental change. | Acquire a time course with stable reference controls and record illumination dose, temperature and medium. |
Do not interpret a brighter image as a biological increase until background, exposure, detector range, labeling amount and acquisition settings have been controlled. Fluorescence intensity is an instrument-mediated measurement as well as a property of the labeled sample.9, 10
A fluorophore-selection workflow
- Define the readout. Decide whether the experiment needs localization, relative abundance, absolute concentration, lifetime, energy transfer or a dynamic reporter.
- Start with the instrument. List excitation sources, filters, detector bands, dynamic range, acquisition mode and whether compensation or spectral unmixing is available.
- Set the biological constraints. Record sample autofluorescence, fixation or live-cell conditions, target abundance, probe size, delivery method and allowable illumination.
- Shortlist by photophysics. Compare full excitation/emission spectra, brightness, photostability, pH sensitivity, lifetime, labeling ratio and conjugate behavior.
- Design the controls before labeling samples. Plan unlabeled, single-color, no-primary or target-negative controls and an appropriate positive control.
- Validate linearity and specificity. Check background subtraction, detector range, concentration dependence and target-specific response before collecting the final dataset.
- Document the conditions. Record fluorophore name and form, conjugation or expression construct, instrument settings, filters, exposure or laser power and analysis method.
For a new fluorophore or instrument configuration, treat published spectral values as starting points. The final performance depends on the probe formulation, conjugate, sample and optical path used in the experiment.
Common questions
Is a fluorophore the same as a fluorescent protein?
No. A fluorescent protein is one class of fluorescent label whose chromophore forms within a protein scaffold. Small organic dyes, quantum dots and fluorogenic probes are other classes with different size, chemistry and photophysics.
Does a longer-wavelength fluorophore always produce a better image?
No. Longer wavelengths can reduce some sources of background in particular samples, but brightness, detector sensitivity, optical transmission, target abundance and photostability still determine the measured signal.
Can overlapping emission spectra be used in a multiplex panel?
Sometimes. Compensation or spectral unmixing can separate overlapping signals when the instrument captures reliable reference information. The final panel still requires single-color controls and an assessment of spreading error or cross-talk.
Is quantum yield a measurement of brightness in my experiment?
No. Quantum yield is one photophysical component. The observed signal also depends on absorption, labeling amount, illumination, optics, detector response, background and saturation.
Related EnkiLife resources
Use the EnkiLife Cell Markers resource for marker-related assay categories and the EnkiLife Immunology resource for related detection and reagent categories. Confirm the current conjugate, species, application, validation evidence and lot-specific information on each product page before choosing a reagent.
References
- Mullins JM. Fluorochromes: properties and characteristics. Methods Mol Biol. 2010;588:123–134. PMID: 20012826.
- Demchenko AP. Photobleaching of organic fluorophores: quantitative characterization, mechanisms, protection. Methods Appl Fluoresc. 2020;8:022001. PMID: 32028269.
- Zimmermann T. Clearing up the signal: spectral imaging and linear unmixing in fluorescence microscopy. Methods Mol Biol. 2014. PMID: 24052349.
- Principles of resonance energy transfer. Curr Protoc Cell Biol. 2022. PMID: 36507547.
- Fluorescence lifetime imaging microscopy: fundamentals and advances in instrumentation, analysis, and applications. J Biomed Opt. 2020. Full text.
- Cranfill PJ, et al. Quantitative assessment of fluorescent proteins. Nat Methods. 2016;13:557–562. PMID: 27240257.
- Tsien RY. The green fluorescent protein. Annu Rev Biochem. 1998;67:509–544. PubMed.
- Medintz IL, et al. Quantum dots as fluorescent probes for in vitro and in vivo bio-molecular and cellular imaging. Nat Mater. 2005;4:435–446. Full text.
- Cossarizza A, et al. Guidelines for the use of flow cytometry and cell sorting in immunological studies. Eur J Immunol. 2021. Full text.
- Waters JC. Accuracy and precision in quantitative fluorescence microscopy. J Cell Biol. 2009;185:1135–1148. Full text.
- Rasnik I, et al. Photophysics of fluorescent probes for single-molecule biophysics and super-resolution imaging. Nat Methods. 2013. PMID: 24141280.
 | Flora Flora is a technical support expert at EnkiLife, familiar with immunology and neuroscience, dedicated to providing customers with high-quality product combinations and technical support to help achieve research in neurodegenerative diseases and other neuroscience areas. |