Literature Sharing: A Spatially Resolved Atlas of Gastric Cancer Reveals the Critical Role of Lymphocyte-Aggregated Regions
1. Research Background
As a high-incidence digestive tract malignant tumor worldwide, gastric cancer has high morbidity and mortality rates. Clinical treatment still faces prominent problems such as poor prognosis for advanced patients and uneven response rates to immunotherapy. The complex characteristics of the tumor microenvironment are one of the key factors affecting treatment efficacy and patient survival. Studies have confirmed that the tumor microenvironment is not a single collection of tumor cells, but a complex ecosystem composed of immune cells, non-immune cells, and extracellular matrix. The cellular composition and spatial distribution directly affect the clinical outcomes of cancer patients, especially the distribution and functional status of immune cells, which are the core determinants of anti-tumor immune response efficiency. Despite the development of single-cell RNA sequencing (scRNA-seq) technology, which has provided a powerful tool for analyzing the immune cell composition of various cancers and can accurately identify different types of immune cell subtypes, this technology cannot capture the spatial location information of cells in tissues. This leads to unclear understanding of the spatial distribution patterns of lymphocytes, especially the impact of tertiary lymphoid structures (TLSs) on their distribution. As important aggregation sites for lymphocytes in the tumor microenvironment, the presence and maturation degree of tertiary lymphoid structures are closely related to the prognosis of patients with various cancers. However, due to the lack of spatial dimension research, the specific mechanisms by which they regulate lymphocyte distribution and participate in anti-tumor immunity have not been fully elucidated. At the same time, previous studies inferring cell-cell interactions in the tumor microenvironment based on single-cell sequencing data mostly relied on computer simulation predictions of gene expression, lacking in-situ exploration based on the spatial co-occurrence of ligands and receptors. This makes it difficult to accurately analysis the actual occurrence scenarios and regulatory mechanisms of cell-cell communication. In addition, the spatial distribution characteristics, activation mechanisms, and interactions with other cells of T cell subsets, especially exhausted T cells which are key indicators for prognosis evaluation and immunotherapy response, have not been thoroughly studied. Based on the above research gaps and clinical needs, the article "A spatially resolved atlas of gastric cancer characterises a lymphocyte-aggregated region" focuses on the tumor microenvironment (TME), a core target for cancer immunotherapy. By integrating single-cell transcriptomics and spatial transcriptomics technologies, it constructs a spatially resolved cell atlas of gastric cancer, aiming to systematically reveal the spatial organization characteristics of the tumor microenvironment, the core role of tertiary lymphoid structures, and the spatial distribution patterns of immune checkpoint molecules. This provides a new perspective for the exploration of biomarkers for gastric cancer immunotherapy and a scientific basis for the formulation of clinical individualized immunotherapy strategies.
2. Research Methods
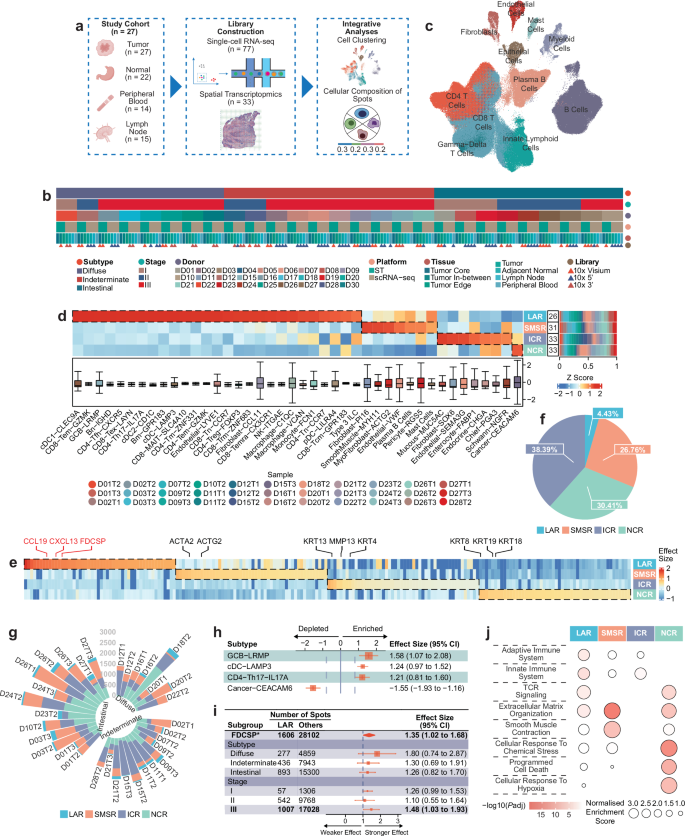
The study recruited 27 treatment-naive gastric cancer patients and collected four types of tissue samples: surgically resected tumors, histologically normal adjacent tissues, lymph nodes, and peripheral blood. Transcriptomic data of 470,609 single cells were obtained through single-cell RNA sequencing, while 33 spatial transcriptomic (ST) sections were analyzed from 19 tumor samples, covering three sampling locations: tumor core, intermediate region, and edge, resulting in 61,035 ST spot data. First, a high-resolution single-cell atlas was constructed, identifying 8 major cell types and 53 cell subtypes. BBKNN was used to eliminate platform batch effects, and the Leiden algorithm was used for clustering analysis. Subsequently, the RCTD method was combined to integrate single-cell and spatial transcriptomic data, clustering ST spots into four spatial regions, which were verified and named in combination with H&E staining images. Gene set enrichment analysis (GSEA) was used to explore the signaling pathway activity of each spatial region, multiplex immunohistochemistry (mIHC) was used to verify the expression of key cell subtypes and molecules, survival analysis was performed in combination with the TCGA database, and the RedeHist algorithm was used for nuclear segmentation and gene expression inference to systematically analyze the spatial distribution of cell subsets, cell-cell interactions, and their associations with clinical phenotypes.
3. Result Analysis
Spatial Distribution of Cell Subtypes in the Tumor Microenvironment
To establish the basic framework of the entire study and clarify the cellular composition and spatial characteristics of the tumor microenvironment, the research first clearly presented the complete research process: collecting four types of tissue samples from 27 gastric cancer patients, performing single-cell RNA sequencing and spatial transcriptomic analysis respectively, then constructing a spatially resolved atlas through integrated analysis, while displaying core information of the four tissues to provide reference for subsequent tissue-specific analysis. Through UMAP projection analysis of 470,609 single cells and color coding by major cell types, the study successfully identified 8 major cell types including immune cells such as T cells, B cells, and myeloid cells, as well as non-immune cells such as endothelial cells, stromal cells, and epithelial cells. Each cell type was verified by classic gene markers to ensure the accuracy of cell typing. To further clarify the spatial distribution patterns of cell subtypes, the study used the RCTD method to obtain heatmaps of enrichment scores of each cell subtype in different spatial regions (normalized by z-score), combined with stacked bar charts to show the proportion of each spatial region in all ST samples, and box plots to present the distribution of enrichment scores of each cell subtype in 61,035 spots. Finally, four spatial regions with unique cell subtype compositions were successfully identified, and it was found that the enrichment score deviation of lymphocyte subtypes was small, while that of non-lymphocyte subtypes was large. This phenomenon is hypothesized to be closely related to the migration characteristics of lymphocytes in tumor tissues. To provide molecular basis for the functional localization of each spatial region, the study screened differentially expressed genes in each region and drew heatmaps, finding that one region highly expressed lymph node-related genes such as CXCL13 and CCL19, while another region highly expressed smooth muscle-related genes such as ACTA2 and ACTG2. In addition, the study also counted the proportion of the four spatial regions in all ST samples, finding that the lymphocyte-aggregated region had the lowest proportion; at the same time, grouped by gastric cancer subtype, the proportion of each spatial region in each ST sample was presented, revealing differences in spatial region distribution among different subtypes of gastric cancer. To clarify the immune characteristics of the lymphocyte-aggregated region, the study analyzed the enriched and depleted cell subtypes in this region through forest plots, using effect size...
LAR Region: Priming of Naive CD8+T Cells
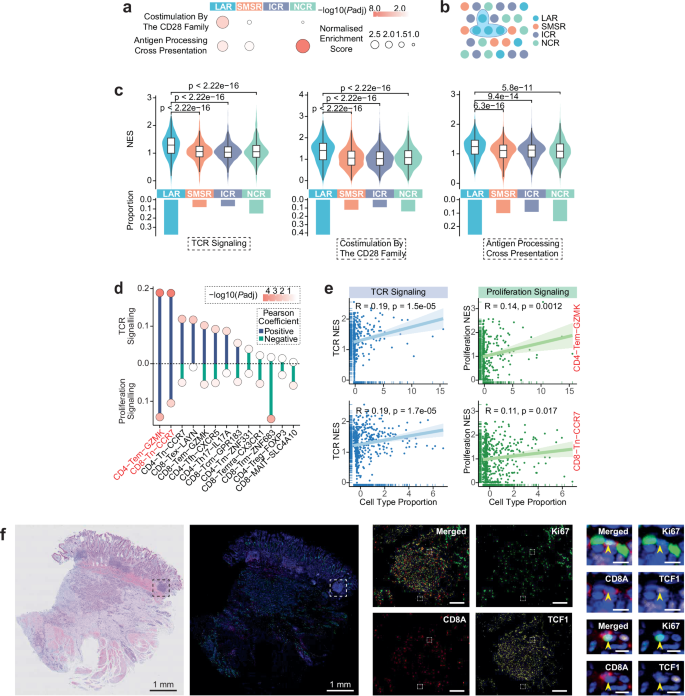
To explore the core function of the lymphocyte-aggregated region (LAR), the study focused on the T cell activation process and conducted systematic analysis from three aspects: signaling pathways, cellular associations, and experimental verification. To clarify the T cell activation potential of different spatial regions, the study displayed the intensity of T cell activation-related signaling pathways in each spatial region through bubble charts, finding that key pathway signals such as CD28 family co-stimulation and antigen processing cross-presentation were significantly enhanced in the LAR region, providing solid molecular evidence for T cell activation. To achieve fine-grained analysis within the region, the study defined spatial blocks as collections of spatially adjacent spots in the same ST group, using these as subsequent research units. To further verify the core role of the LAR region in T cell activation, the study compared the normalized enrichment scores (NES) of key T cell activation pathways and the proportion of spots enriched in these pathways across different spatial regions through a combination of violin plots and bar charts, confirming that both the intensity of T cell activation pathways and the proportion of activated spots in the LAR region were significantly higher than in other regions. To screen key T cell subsets related to T cell activation, the study displayed the Pearson correlation coefficients and statistical significance between T cell subset abundance and two T cell activation-related pathways through lollipop charts, further focusing on CD4-Tem-GZMK and CD8-Tn-CCR7 subsets, and presenting their cell abundance through scatter plots...
LAR Developmental Spectrum and Its Association with Anti-tumor Immunity
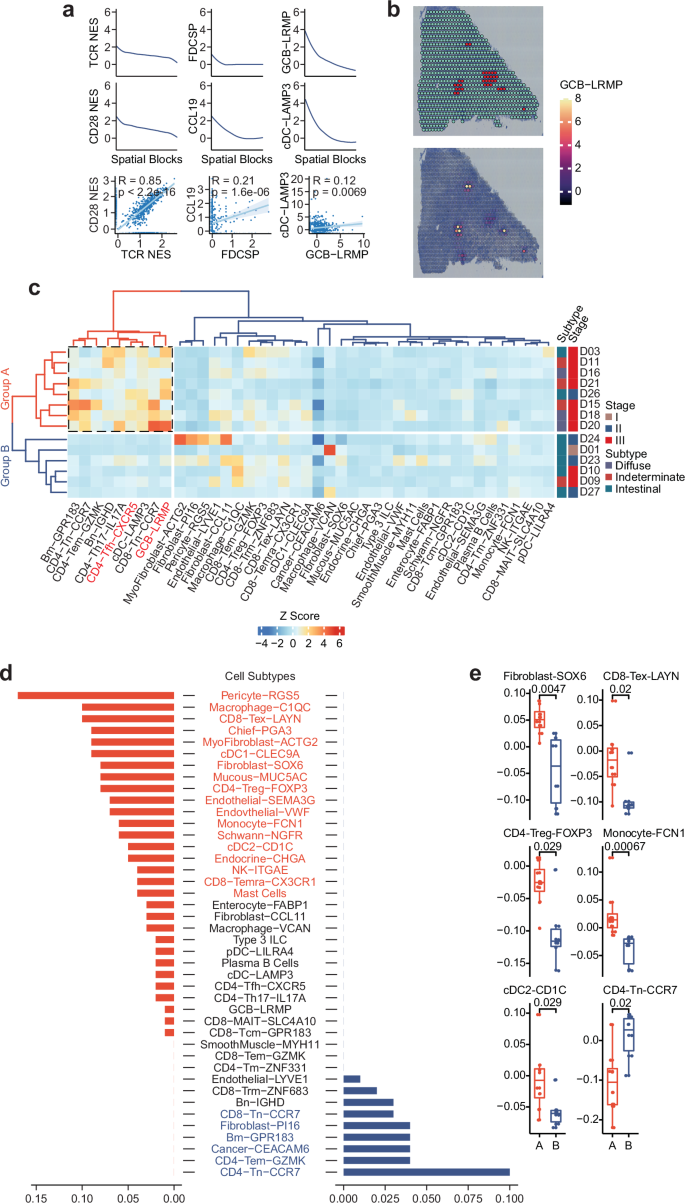
To deeply analyze the heterogeneity of lymphocyte-aggregated regions and their impact on lymphocyte distribution in the tumor microenvironment, the study conducted a series of targeted analyses. To explore the synergy of functional indicators in LAR regions, the study displayed the expression trends of T cell activation-related signaling pathways, gene markers (FDCSP, CCL19), and cell subtypes (GCB-LRMP, cDC-LAMP3) in different LAR spatial blocks through line charts, and presented the associations between various indicators through scatter plots. It was found that there were significant positive correlations between TCR signaling pathway and CD28 signaling pathway, between CCL19 and FDCSP, and between GCB-LRMP and cDC-LAMP3. To verify the internal heterogeneity of LAR regions, the study performed overlay analysis of H&E images of specific samples with GCB-LRMP cell abundance, marking LAR regions in red and using color density to indicate cell abundance differences. The results showed that even within a single sample's LAR block, GCB-LRMP cell abundance exhibited heterogeneity. Subsequently, box plots were used to compare the differences in the abundance of key cell subtypes between 16 patients in Group A and 10 patients in Group B, which further validated this distribution discrepancy and ultimately revealed the regulatory effect of distinct LAR subpopulations on the distribution of lymphocytes in the tumor microenvironment: activated lymphocytes aggregate in the cancerous regions adjacent to LARs in Group A, while resting lymphocytes accumulate in those of Group B.
Spatial Distribution Patterns of Immune Checkpoint Molecules in Tumors
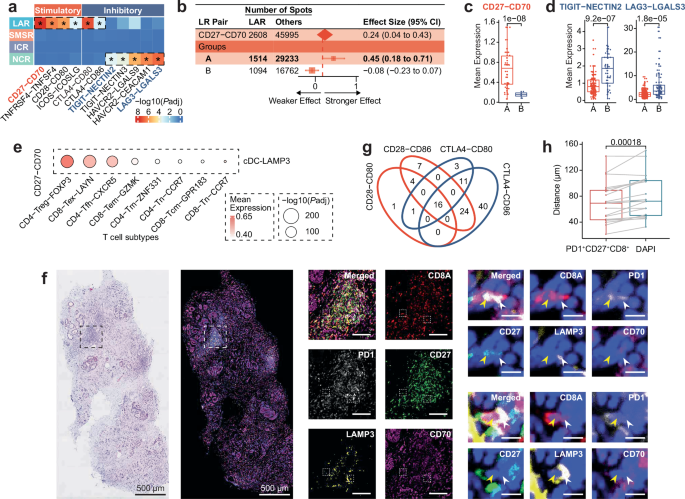
To explore potential immunotherapy targets, the study systematically investigated the spatial distribution of immune checkpoint ligand-receptor pairs, clarifying their spatial-specific characteristics. The study first analyzed the enriched immune checkpoint ligand-receptor pairs in different spatial regions, finding that lymphocyte-aggregated regions were significantly enriched in stimulatory ligand-receptor pairs, especially CD27-CD70, while hypoxia-related regions were significantly enriched in inhibitory ligand-receptor pairs, such as LAG3-LGALS3 and TIGIT-NECTIN2. Smooth muscle-related regions and another cancerous region did not show significant ligand-receptor pair enrichment. To explore the association between the CD27-CD70 stimulatory axis and patient grouping, the study presented its relationship with groups A and B through forest plots, finding that the expression of this axis in group A LAR blocks was significantly higher than in group B. Subsequently, box plots were used to directly compare the expression levels of CD27-CD70 in LAR blocks between the two groups, further verifying the dominant expression of this stimulatory axis in group A LAR. Meanwhile, the study used box plots to compare the expression levels of the inhibitory axes LAG3-LGALS3 and TIGIT-NECTIN2 in the NCR blocks of Group A and Group B, and found that the expression of these inhibitory axes was significantly higher in the NCR blocks of Group B. Combined with the finding that the abundance of Cancer-CEACAM6 cells was higher in the cancerous regions of Group B, it was hypothesized that cancer cells may be involved in the regulatory control of the expression of these inhibitory axes. To clarify the cellular source of the CD27-CD70 axis, the study inferred based on single-cell RNA sequencing data and bubble chart analysis that cDC-LAMP3 cells can communicate with T cell subsets such as CD4-Treg-FOXP3 and CD8-Tex-LAYN through this axis. To verify this cell-cell interaction at the in-situ level, the study used mIHC staining technology to observe the expression of CD8A, PD1, CD27, LAMP3, and CD70 in specific samples. Through views at different magnification levels, physical contact between PD1+CD27+CD8+ cells and CD70+LAMP3+ cells in the LAR region was clearly observed, and this phenomenon was found in both the main cohort and the independent validation cohort. To explore the balance state of immune checkpoint molecules in the LAR region, the study displayed LAR spatial blocks expressing both CD28 and CTLA4-related axes through Venn diagrams, finding that such blocks were mainly concentrated in group A, suggesting that there may be a balance state of CD28 and CTLA4 competing for CD80/CD86 binding in group A LAR regions. Finally, the study compared the average distance between PD1+CD27+CD8+ cells and CD70+LAMP3+ cells in the LAR region, as well as the average distance between DAPI and CD70+LAMP3+ cells, through box plots, finding that the former was significantly shorter, further confirming the close interaction between the two cell types and providing strong spatial evidence for CD27-CD70 axis-mediated T cell activation.
4. Research Conclusions and Significance
By integrating single-cell and spatial transcriptomics technologies, this study successfully constructed a high-resolution spatially resolved cell atlas of gastric cancer, identifying four spatial regions with unique transcriptomic characteristics (LAR, SMSR, ICR, NCR). Among them, the LAR region, as a lymphocyte-aggregated region containing lymphocyte aggregates and tertiary lymphoid structures, plays a key role in T cell activation, lymphocyte distribution regulation, and immune checkpoint molecule expression. The study found that the abundance of naive T cells in the LAR region was significantly associated with T cell activation-related pathways, and LAR exhibited heterogeneity, which could be divided into groups A and B, corresponding to the aggregation of activated and resting lymphocytes in cancerous regions, respectively. At the same time, the LAR region was enriched in stimulatory immune checkpoint axes such as CD27-CD70, and PD1+CD27+CD8 T cells in group A LAR were closely aggregated with CD70+LAMP3+ dendritic cells, providing spatial and molecular basis for T cell activation. This study not only reveals the spatial organization characteristics of the gastric cancer tumor microenvironment but also provides new targets for the screening of immunotherapy biomarkers and important reference for the formulation of individualized gastric cancer immunotherapy strategies. At the same time, its research method integrating single-cell and spatial transcriptomics also provides a reference for tumor microenvironment research in other cancers.
References
Gao S, Qin S, Wang D, Wang A, Zhu L, Li Y, Shi Q, Fan H, Bo Y, Zhong Y, Sun Y, Dong K, Fu L, Gao R, Wu Y, Liang Y, Huang L, Hu X, Ren X, Bu Z, Ji J, Zhang Z. A spatially resolved atlas of gastric cancer characterises a lymphocyte-aggregated region. Nat Commun. 2026 Jan 27;17(1):2059. doi: 10.1038/s41467-026-68612-z. PMID: 41593079; PMCID: PMC12948980.
EnkiLife mIHC TSA Kits
Product | Catalog Number |
|---|---|
TSA Six-Label Seven-Color Multiplex Immunohistochemistry Kit | |
TSA Five-Label Six-Color Multiplex Immunohistochemistry Kit | |
TSA Four-Label Five-Color Multiplex Immunohistochemistry Kit | |
TSA Three-Label Four-Color Multiplex Immunohistochemistry Kit | |
TSA Two-Label Three-Color Multiplex Immunohistochemistry Kit |