Literature Sharing: Assessment of Inflammatory Cell Infiltration in Kidney Transplant Biopsies Using Multiplex Immunofluorescence Technology
1. Research Background
Delayed graft function (DGF) after kidney transplantation is a common complication, defined as the need for dialysis within 7 days post-transplantation, and is an important risk factor for chronic kidney transplant injury. Interstitial fibrosis and tubular atrophy (IFTA) are typical manifestations of chronic kidney injury. However, not all DGF patients progress to IFTA, and the complex association between them remains unclear. The core bottleneck is that traditional assessment methods have difficulty accurately quantifying inflammatory infiltration characteristics and cannot early identify predictive markers for IFTA progression. Traditional histological assessment relies on the subjective judgment of pathologists, with accuracy greatly influenced by experience, and cannot simultaneously capture information on the phenotype, density, and spatial distribution of multiple types of immune cells, limiting in-depth exploration of the association between the inflammatory microenvironment and graft prognosis. "Quantitative assessment of inflammatory infiltrates in kidney transplant biopsies using multiplex tyramide signal amplification and deep learning" focuses on technological innovation in the quantitative assessment of inflammatory infiltration in kidney transplant biopsies, aiming to solve the clinical challenge of predicting interstitial fibrosis and tubular atrophy progression in patients with delayed graft function, and achieving precise quantitative analysis of inflammatory infiltration through technology integration.
2. Core Technologies
mTSA is based on the principle of tyramide signal amplification, which catalyzes the oxidative activation of tyramide molecules through horseradish peroxidase, causing them to covalently deposit a large number of fluorescent reporter groups in the area adjacent to the target antigen. The signal amplification factor can reach 10-100 times, enabling efficient detection of low-abundance antigens. The study designed two sets of mTSA detection methods: the first set is used to visualize capillaries, T lymphocytes, B lymphocytes, and macrophages; the second set focuses on T helper cells and macrophage subsets. Breaking through the limitation of traditional immunohistochemistry where only 1-2 targets can be labeled on a single section, simultaneous in-situ labeling of multiple cell types is achieved. Subsequently, through multispectral imaging, the images are converted into artificial brightfield whole-slide images using custom Python scripts, balancing imaging sensitivity with pathologists' reading habits, and compatible with formalin-fixed paraffin-embedded samples, adapting to routine clinical pathology sample types.
The analysis uses convolutional neural networks (CNNs) to construct a cell recognition model, whose core advantage is the ability to automatically extract feature information from images, such as cell morphology, staining intensity, and texture features, avoiding the limitations of manual feature extraction. The model is optimized based on existing immunohistochemical cell detection frameworks, designing exclusive recognition algorithms for different staining types of inflammatory cells, strengthening the distinction between cell features and background through multi-layer convolution and pooling operations, and ultimately achieving precise localization and counting of target cells.
3. Result Analysis
Multiplex TSA Experimental Validation
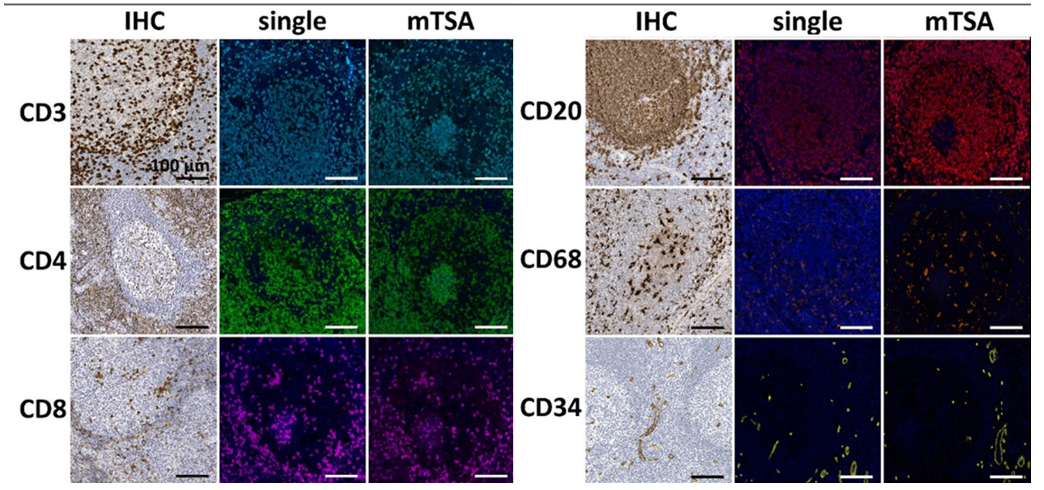
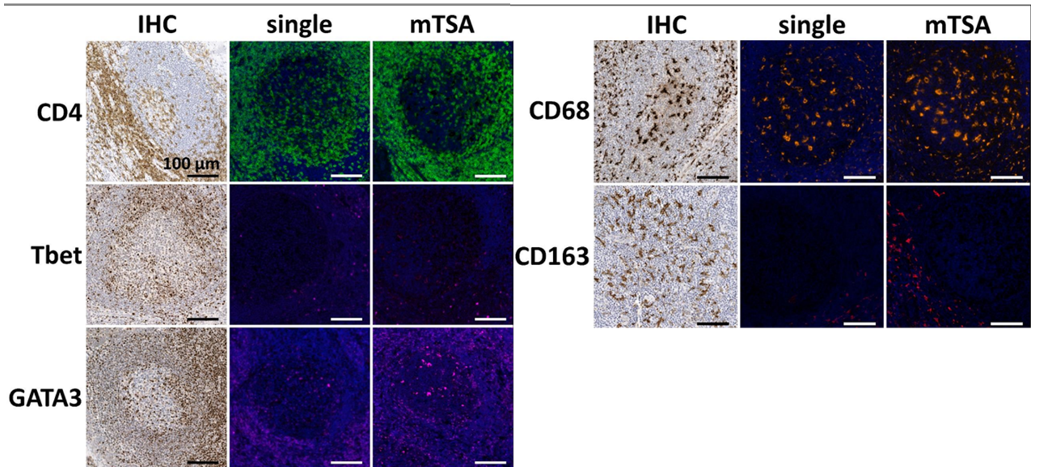
Since mTSA involves multiple antigen retrievals, different antibodies have different tolerances to repeated heat retrieval. Therefore, researchers used formalin-fixed paraffin-embedded tonsil tissue to conduct gradient heat retrieval tolerance tests on 9 target antibodies by simulating 1 to 6 boiling cycles. Chromogenic immunohistochemistry was then performed to evaluate the staining intensity of each antibody at different cycle numbers, and finally the optimal usage order of each antibody in mTSA experiments was determined to ensure that all targets maintained optimal antigen affinity and signal intensity during the multiplex staining process.
If target epitopes co-localize, tyramide deposition may interfere with each other. To detect this spatial hindrance inhibition, the study used control tonsil tissue sections and stained them with the mTSA detection combination. Antibody expression in mTSA was compared with single-stained sections that underwent the same number of boiling retrieval cycles. As shown in the results above, no difference in staining patterns was observed between single-stained sections and multiplex-stained sections.
CNN-Based IHC Positive Cell Detection
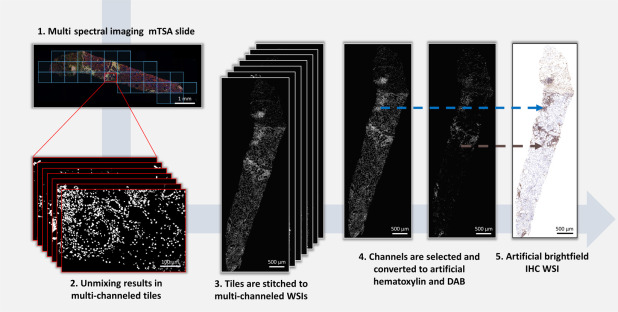
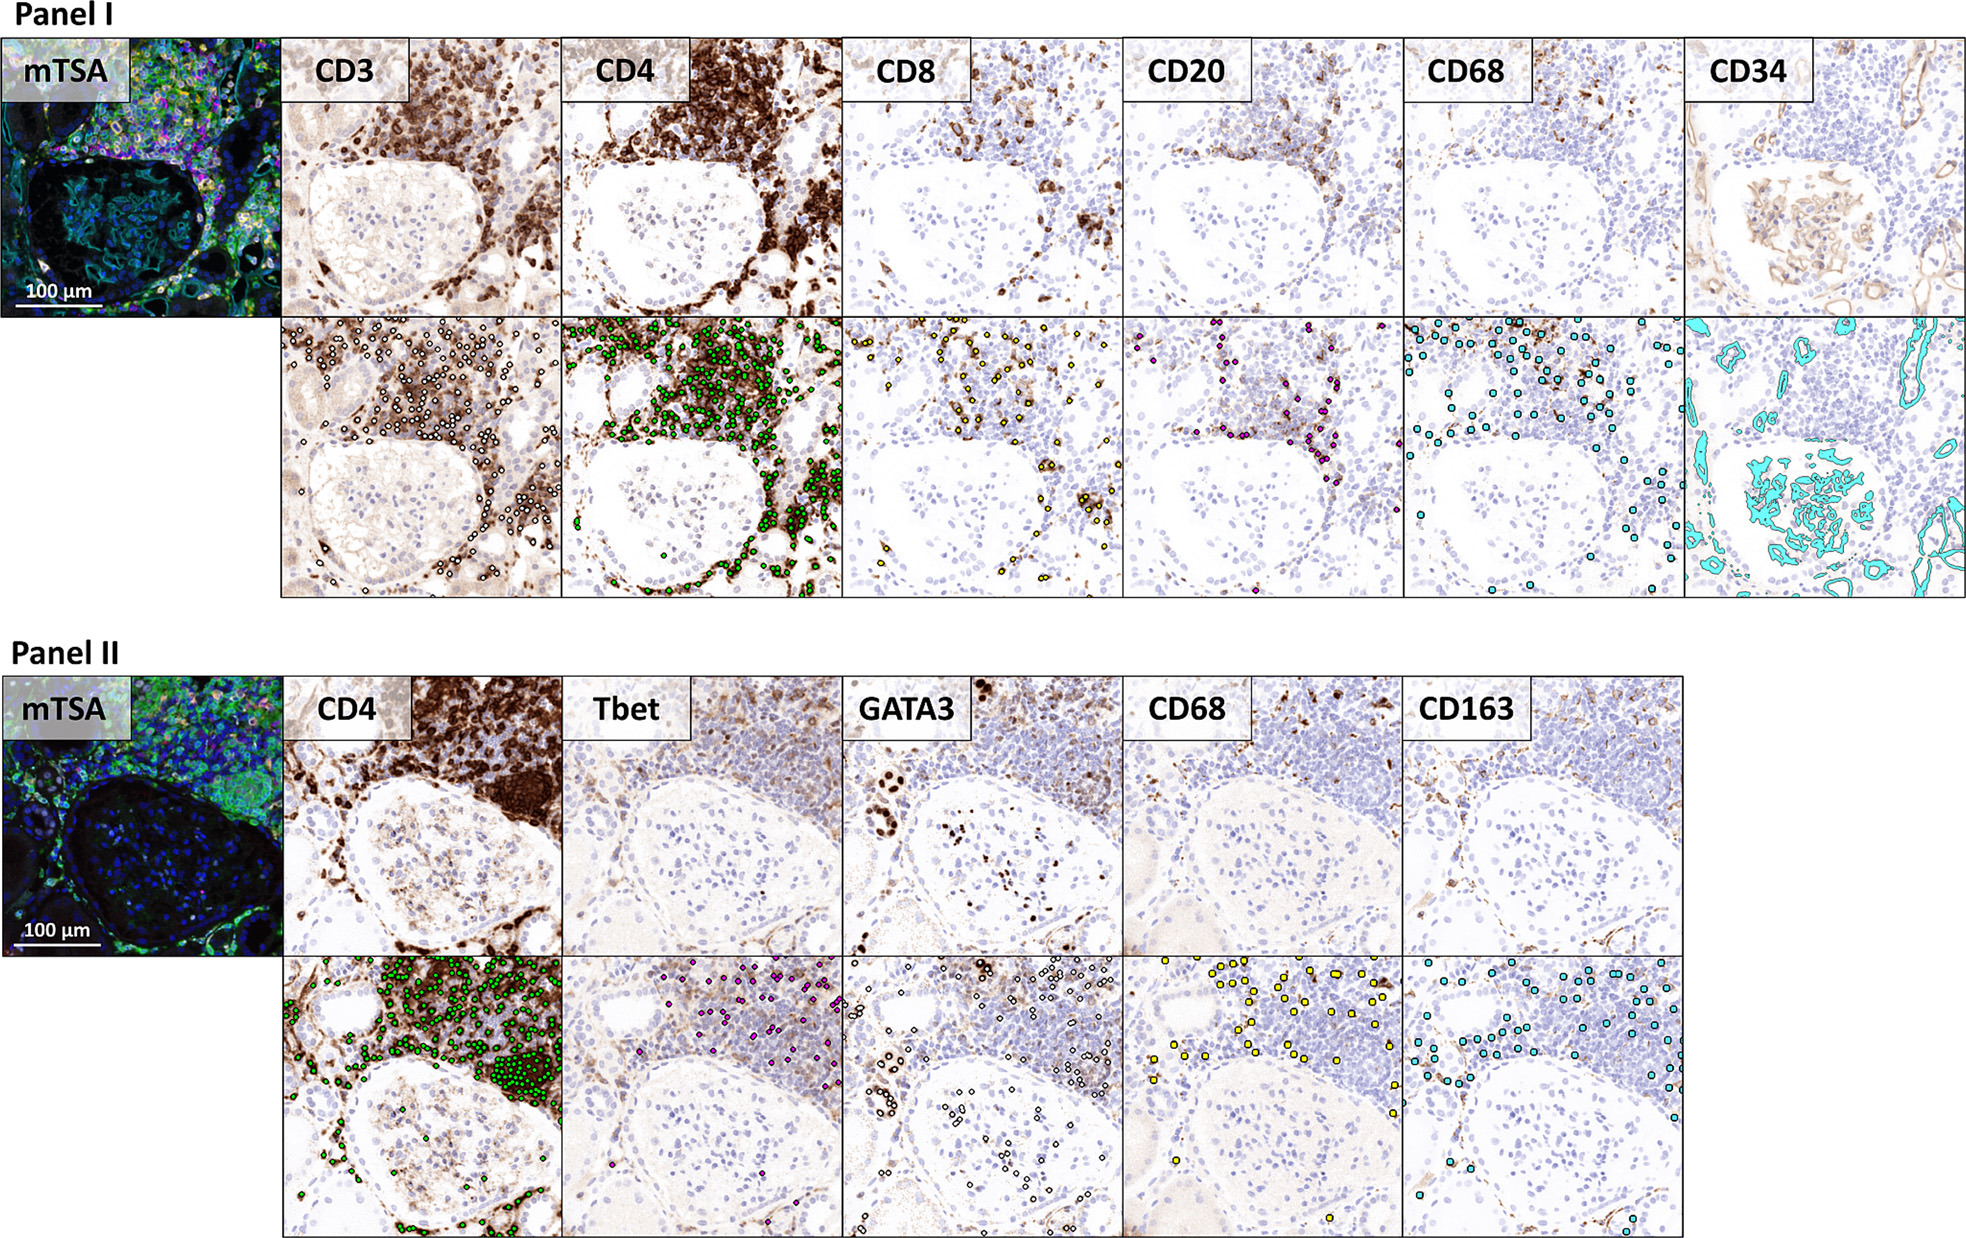
To apply existing convolutional neural networks originally developed for brightfield microscopy, the study converted mTSA fluorescence images to artificial brightfield images. The generated artificial brightfield IHC whole-slide images are suitable for automated analysis by convolutional neural networks trained on traditional IHC whole-slide images.
Correlation Between Different Cell Types
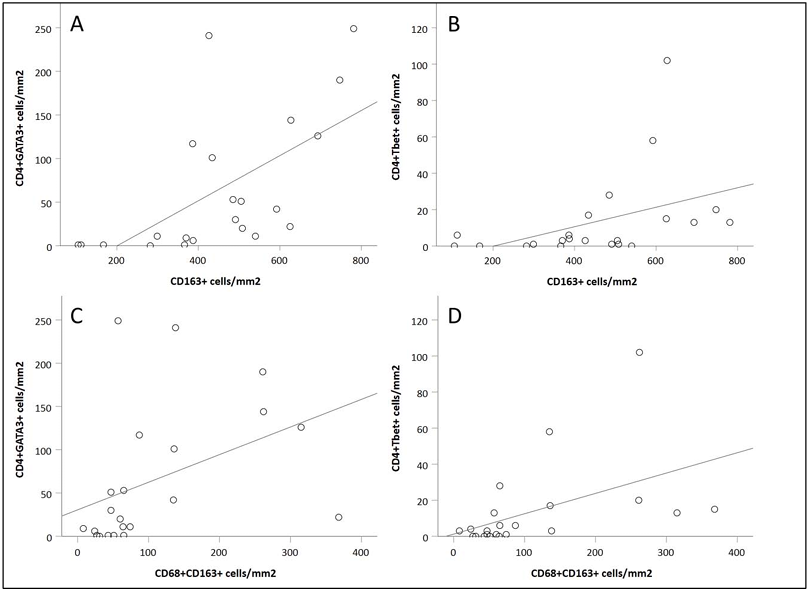
In biopsy samples at 6 weeks post-transplantation, the strongest correlation was observed between CD4⁺GATA3⁺ cell density and CD163⁺ cell density (Figure A). In contrast, the correlation between CD4⁺Tbet⁺ cell density and CD163⁺ cell density was weaker (Figure B). When the cell population was limited to double-positive macrophages (CD68⁺CD163⁺), a significant correlation was still maintained with CD4⁺GATA3⁺ cell density. In addition, a correlation was also observed between CD4⁺GATA3⁺ cell density and CD20⁺ cell density. The correlation between CD4⁺Tbet⁺ cell density and CD20⁺ cell density was weaker. A significant correlation was observed between CD3⁺CD8⁻ cell density and CD3⁺CD8⁺ cell density.
Comparison of Inflammatory Cell Infiltration Between IFTA and Non-IFTA Patients
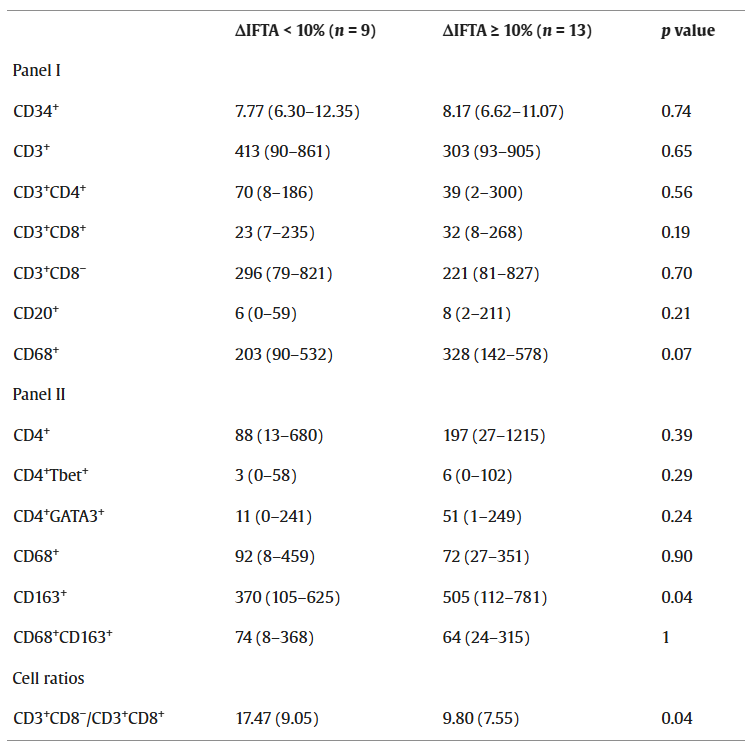
In patients who progressed to IFTA at 6 months post-transplantation, the CD163⁺ cell density in their biopsy samples at 6 weeks post-transplantation was significantly higher than in non-IFTA patients. Therefore, CD163⁺ macrophage infiltration may be a potential predictive indicator for IFTA progression. CD68 and CD4 were used in both detection methods. Assessment of the CD3⁺CD8⁻/CD3⁺CD8⁺ cell ratio showed that patients with IFTA progression < 10% at 6 months post-transplantation had a significantly higher cell ratio than those with IFTA progression ≥ 10%. CD3⁺CD8⁺ cell density was negatively correlated with IFTA progression.
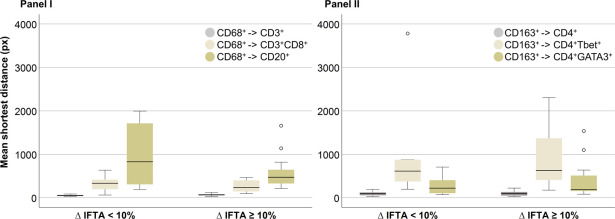
No significant differences were observed between the two groups of patients in the average shortest distances between CD68⁺ cells and CD3⁺, CD3⁺CD8⁺, and CD20⁺ cells, as well as between CD163⁺ cells and CD4⁺, CD4⁺Tbet⁺, and CD4⁺GATA3⁺ cells. This indicates that these two indicators may not be related to short-term IFTA progression.
4. Summary
This study addresses the issues of traditional methods being mainly qualitative, insufficiently quantitative, and limited in multi-target detection through the interdisciplinary integration of mTSA technology and deep learning. mTSA technology ensures high-sensitivity detection of low-abundance immune cell markers and simultaneous multi-target imaging, while the deep learning model achieves automated and standardized quantification of inflammatory cells, avoiding the subjectivity of manual reading. It constructs a precise quantitative assessment method for inflammatory infiltration in kidney transplant biopsies, not only breaking through the limitations of traditional pathological assessment but also discovering clinically valuable predictive markers for IFTA progression, providing important technical support and theoretical basis for precise management and prognosis improvement after kidney transplantation.
References
Hermsen M, Volk V, Bräsen JH, Geijs DJ, Gwinner W, Kers J, Linmans J, Schaadt NS, Schmitz J, Steenbergen EJ, Swiderska-Chadaj Z, Smeets B, Hilbrands LB, Feuerhake F, van der Laak JAWM. Quantitative assessment of inflammatory infiltrates in kidney transplant biopsies using multiplex tyramide signal amplification and deep learning. Lab Invest. 2021 Aug;101(8):970-982. doi: 10.1038/s41374-021-00601-w. Epub 2021 May 18. PMID: 34006891; PMCID: PMC8292146.
EnkiLife mIHC TSA Kits
Product | Catalog Number |
|---|---|
TSA Six-Label Seven-Color Multiplex Immunohistochemistry Kit | |
TSA Five-Label Six-Color Multiplex Immunohistochemistry Kit | |
TSA Four-Label Five-Color Multiplex Immunohistochemistry Kit | |
TSA Three-Label Four-Color Multiplex Immunohistochemistry Kit | |
TSA Two-Label Three-Color Multiplex Immunohistochemistry Kit |