Literature Sharing: Multiplex Immunofluorescence for Tumor Tissue Immune Analysis and Cellular Spatial Distribution Research
1. Research Background
Although tumor immunotherapy has developed rapidly and achieved significant results, malignant tumors can escape immune surveillance by constructing an immunosuppressive microenvironment, which severely limits treatment efficacy. After the discovery of immune checkpoint molecules such as PD-1 and CTLA-4 and their roles in tumor immune evasion, clarifying the interaction between immune cells and cancer cells has become a core prerequisite for developing novel immunotherapies. Multiplex immunofluorescence (mIF) is a reliable high-throughput method that can directly observe multiple biomarkers expressed by individual cells and analyze the spatial relationships of these biomarkers in different cell populations, which is impossible with traditional immunohistochemistry (IHC) techniques. Therefore, the study "Immuno-profiling and cellular spatial analysis using five immune oncology multiplex immunofluorescence panels for paraffin tumor tissue" can identify multiple cell subpopulations by combining carefully selected antibodies. The tyramide signal amplification (TSA) manual protocol was used as a standard reference for validating multiplex staining. The automated stainer significantly reduced the original 4-5 day manual staining time to 14-17 hours while improving staining consistency. The literature demonstrates the optimization process and reproducibility of automated TSA staining, and validates its application value in tumor microenvironment research and cellular phenotype spatial distribution analysis in a small cohort of non-small cell lung cancer (NSCLC) samples.
2. Research Methods
Formalin-fixed paraffin-embedded lung cancer control tissues and human reactive tonsil tissues were used for optimization and reproducibility validation of IHC, single immunofluorescence, and mIF. Non-small cell lung cancer samples were used as research objects for mIF staining and analysis. First, immunohistochemical and single immunofluorescence conditions for markers such as CK, PD-L1, and CD3 were optimized using an automated staining system, and 5 immune oncology multiplex immunofluorescence panels were constructed based on the tyramide signal amplification system. An efficient workflow was established using Opal fluorescent dyes and an automated stainer, reducing staining time and improving consistency. Subsequently, NSCLC samples were stained with mIF, scanned using the Vectra-Polaris 3.0.3 multispectral imaging system, regions of interest were selected by pathologists, and InForm software was used for cell segmentation, phenotype quantification, and colocalization analysis. Multi-panel data were integrated using R language scripts, technical reproducibility was assessed using Spearman correlation coefficients and coefficient of variation, cellular spatial distribution patterns were analyzed by comparing nearest neighbor distance G function with theoretical Poisson function, and data correlations were explored by associating with patients' clinicopathological features.
3. Research Results
NSCLC Multiplex Immunofluorescence
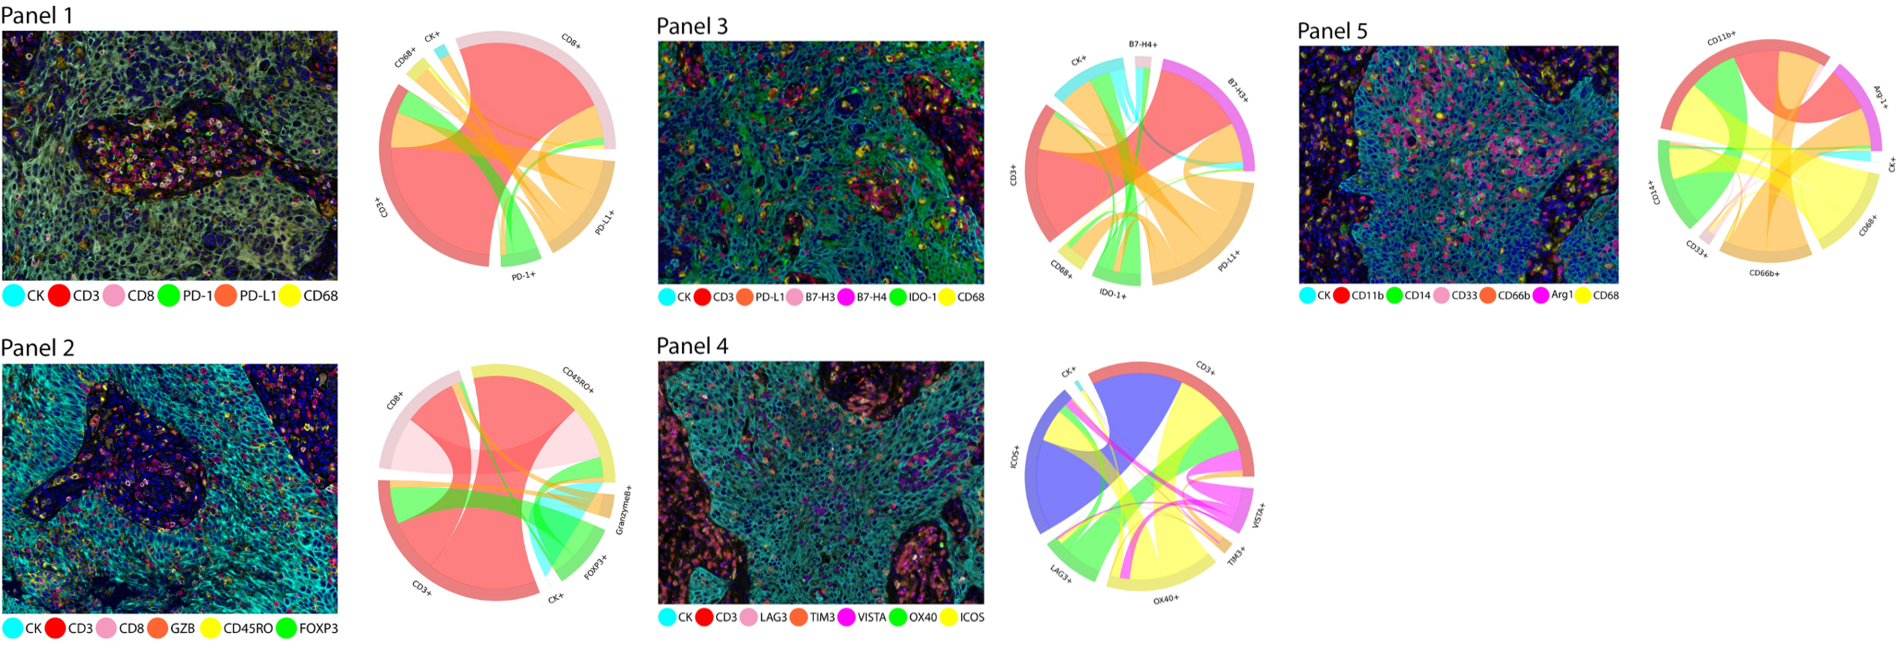
Multiplex immunofluorescence images of different immuno-oncology panels and connection maps of marker co-expressing cells in non-small cell lung cancer tissue sections, used to present cellular phenotypic diversity.
NSCLC Tumor Microenvironment Characterization
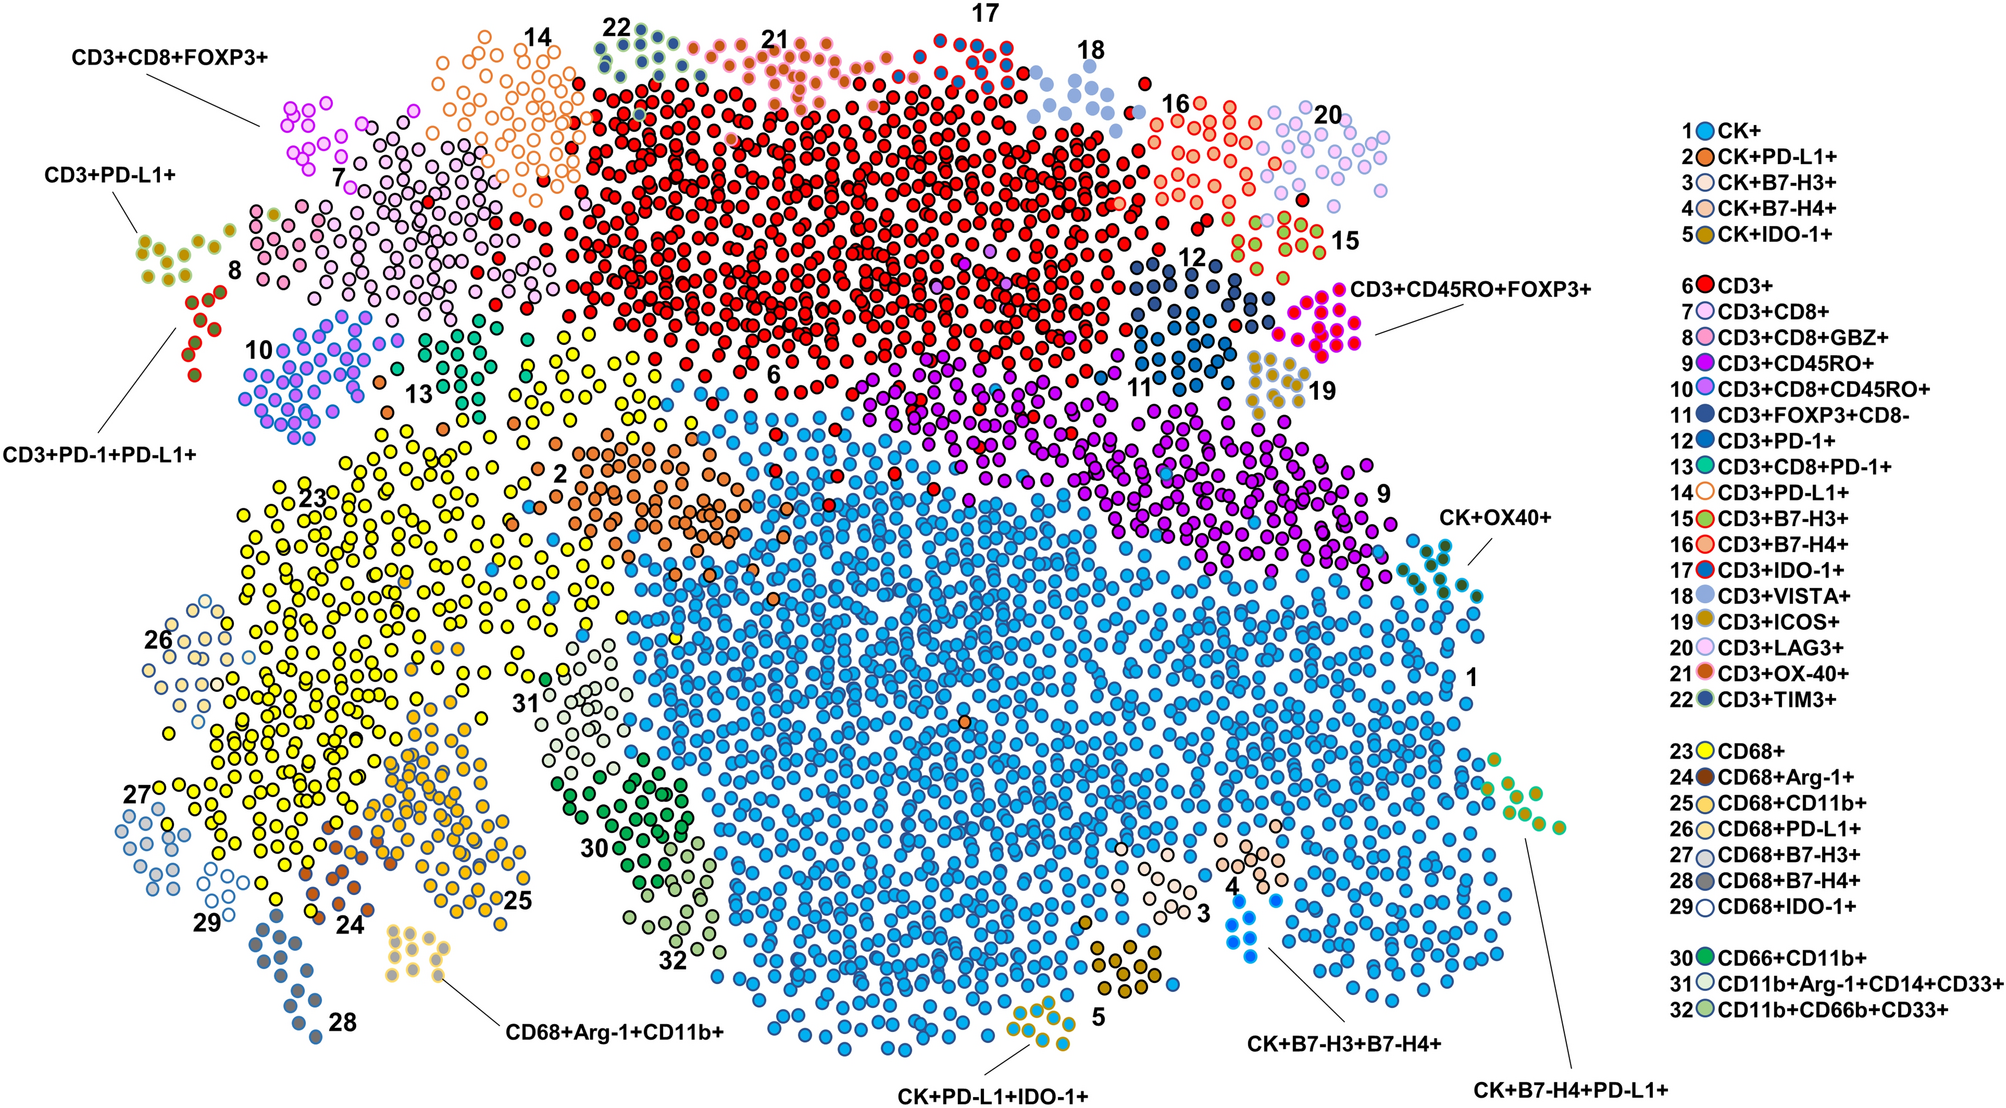
The left graph is a graphical representation of different cellular phenotype clusters obtained through five multiplex immunofluorescence panels. Each cluster represents a cell subpopulation with a specific marker co-expression pattern, and the distinction between different clusters reflects the diversity of cellular phenotypes. This visualization method can intuitively reflect the enrichment levels and interrelationships of various cell subpopulations in the tumor microenvironment. For example, some immunosuppression-related cell phenotypes may form more concentrated clusters, while effector T cell-related phenotypes may present another type of clustering characteristic. The right side clearly lists the cellular phenotypes expected to be observed through the five mIF panels, which are predefined based on the marker combinations of each panel. It covers malignant cell CK+ related phenotypes, T cell subpopulation phenotypes, macrophage-related phenotypes, and myeloid-derived suppressor cell-related phenotypes, comprehensively covering key cell populations in the tumor microenvironment.
Exploring Cellular Spatial Relationships in NSCLC
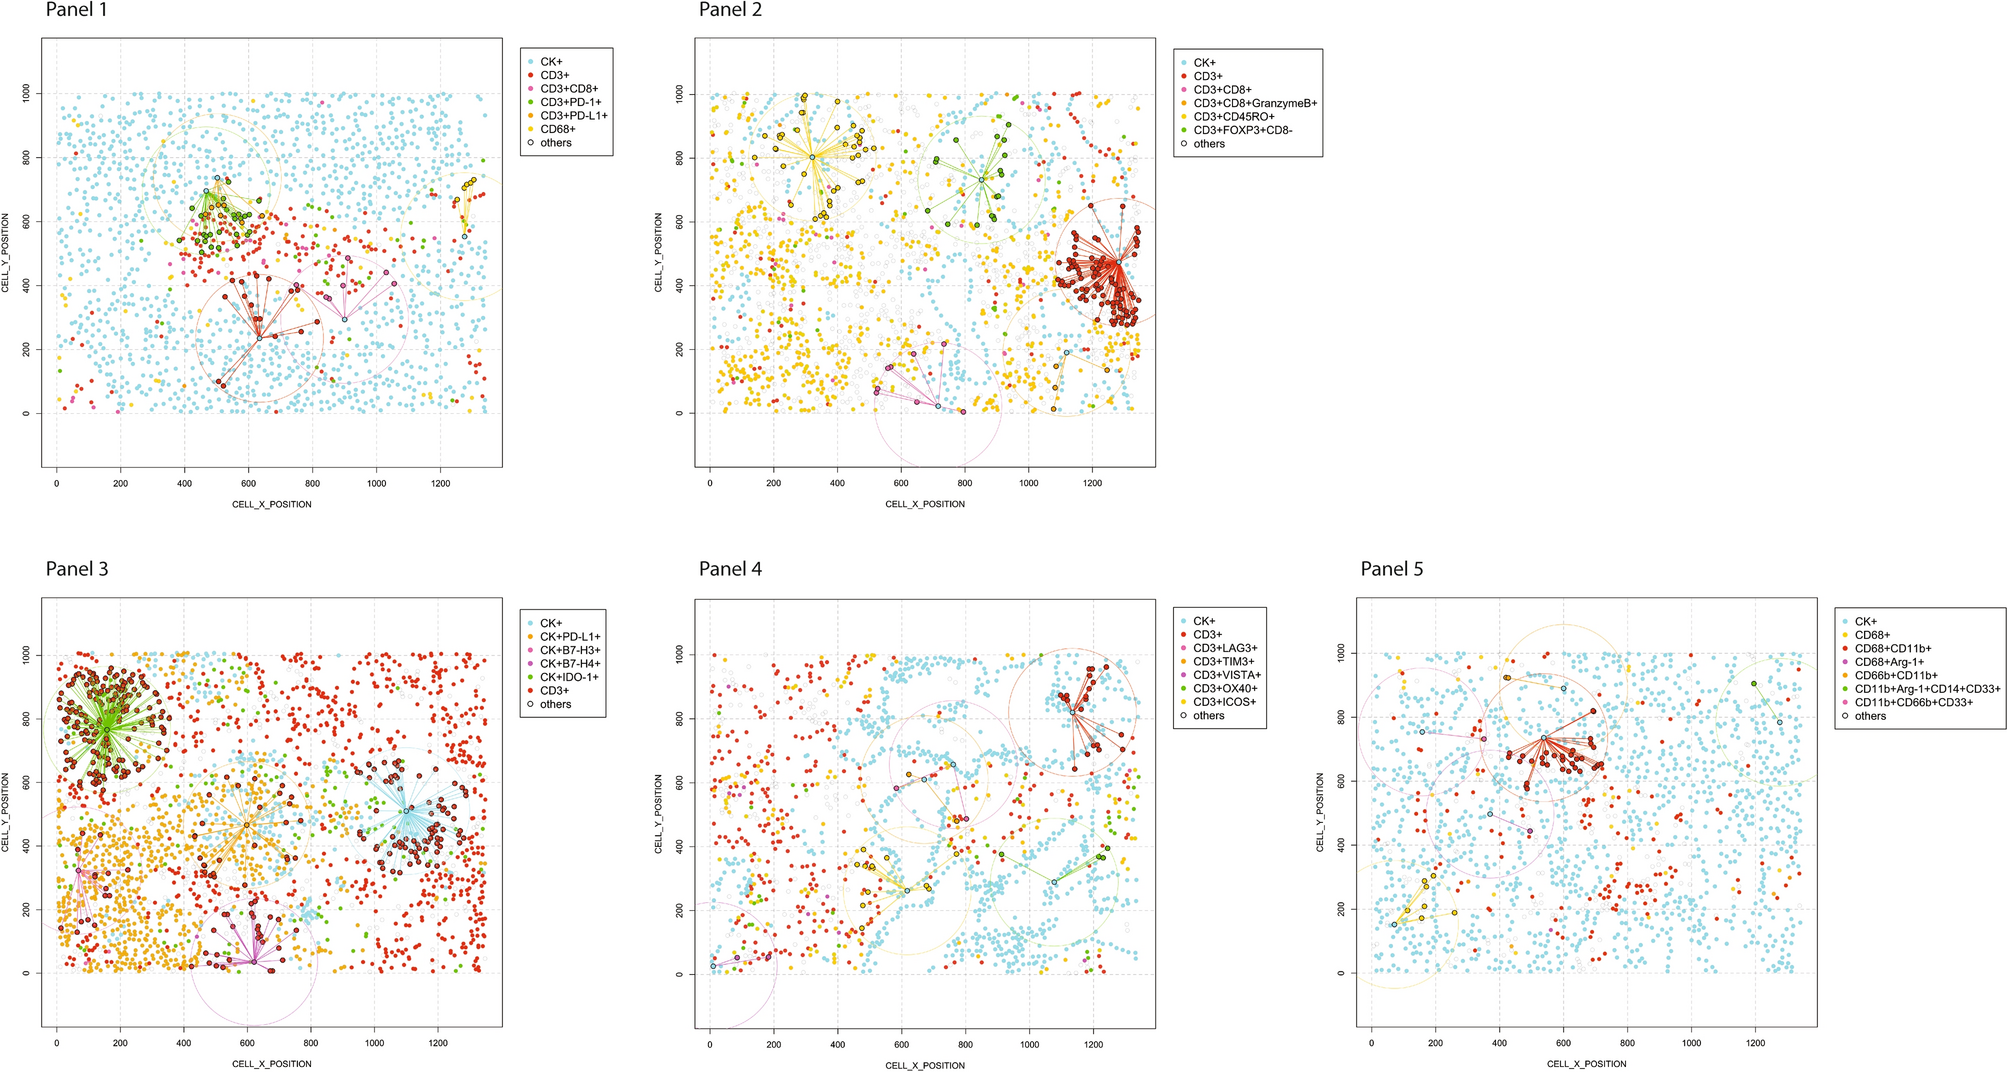
The spatial analysis result graph of non-small cell lung cancer samples visually presents the distance relationships between malignant CK+ cells and various immune cell phenotypes. All distance measurements are centered on CK+ malignant cells, with a radius of 200 micrometers, intuitively distinguishing cell populations close to and distant from malignant cells. It provides an intuitive basis for analyzing the spatial distribution characteristics and interactions of cells in the tumor microenvironment, clearly showing the relative positions of various cells in tumor tissue.
The figure corresponds to 5 mIF panels, each focusing on distance relationships between different cell populations. Panels 1 and 2 show the distance relationships between CK+ malignant cells and different CD3+T cell phenotypes (identified by different color points based on marker expression) and CD68+ macrophages. Panel 3 presents the distance relationships between CK+ malignant cells expressing different immune checkpoint markers and CD3+T cells. Panel 4 shows the distance relationships between CK+ malignant cells and CD3+T cells expressing different immune checkpoint markers. Panel 5 presents the distance relationships between CK+ malignant cells and different CD68+ macrophage phenotypes and other myeloid-derived suppressor cell phenotypes.
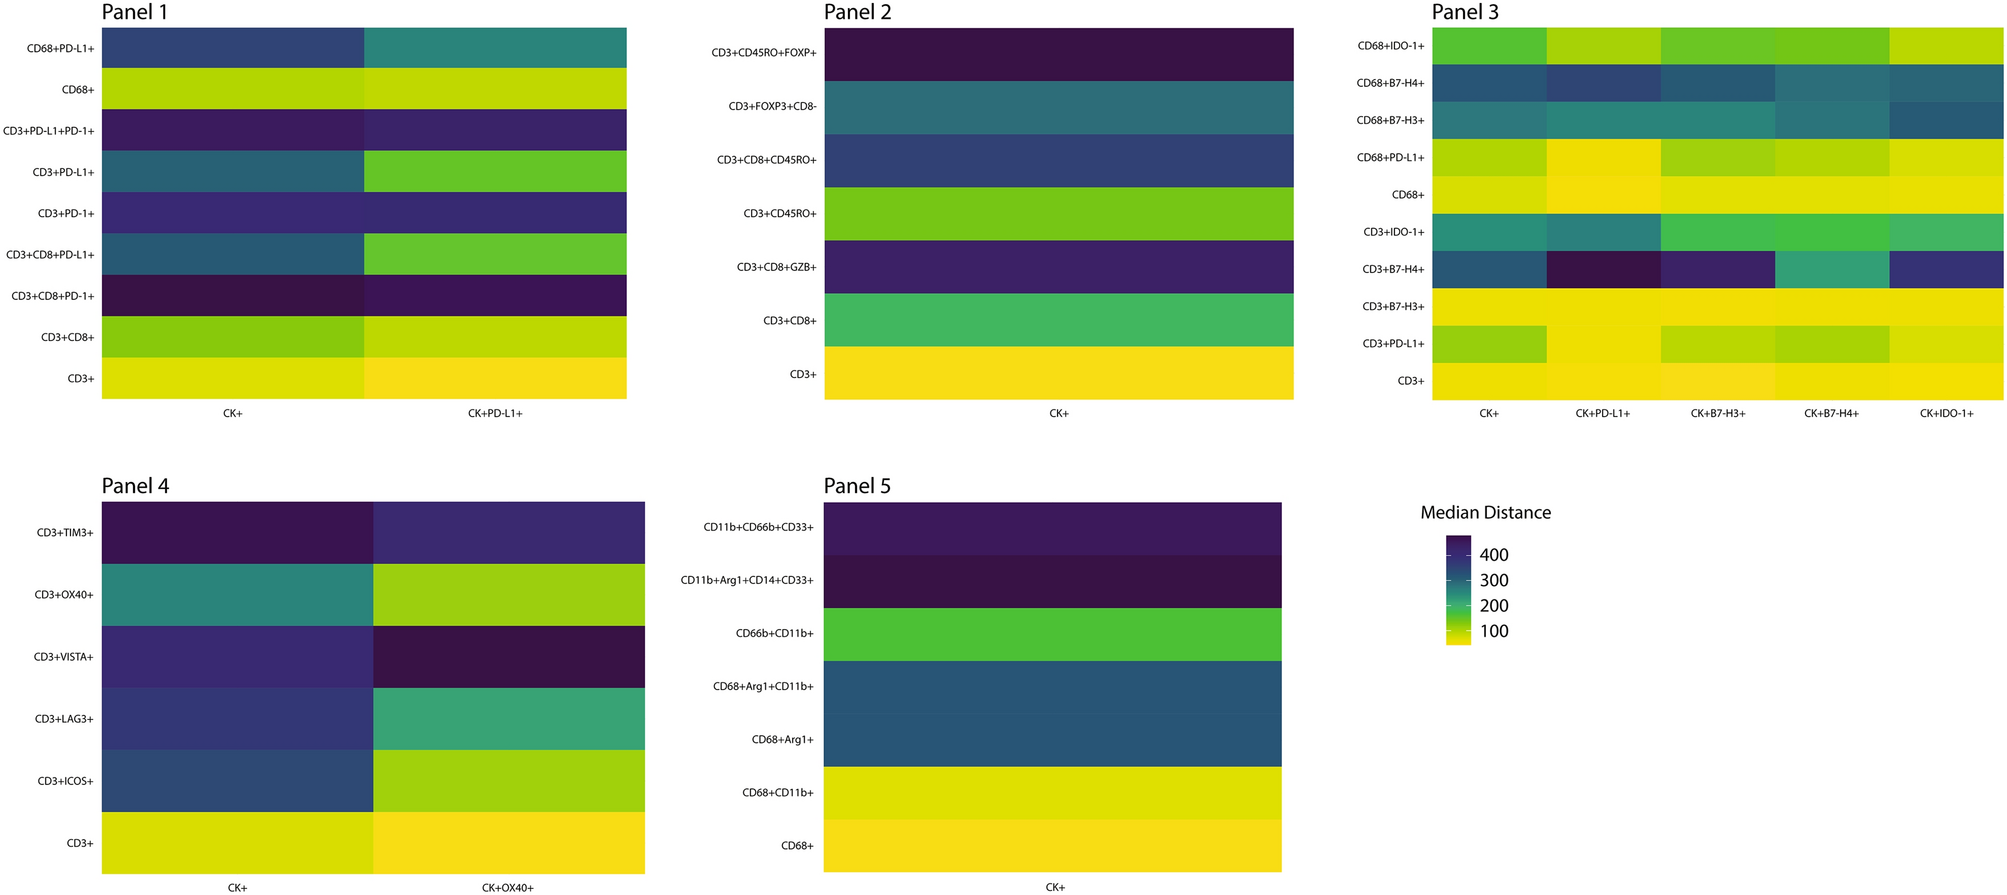
The study also quantified the median proximity of CK+ malignant cells and CK+ malignant cells expressing different immune checkpoint markers to various immune cell phenotypes in the form of a heat map. The color intensity intuitively reflects the distance, with darker colors representing closer median distances between cells and higher interaction possibilities, while lighter colors represent farther distances and lower interaction probabilities.
Exploring Cellular Spatial Distribution Patterns in NSCLC
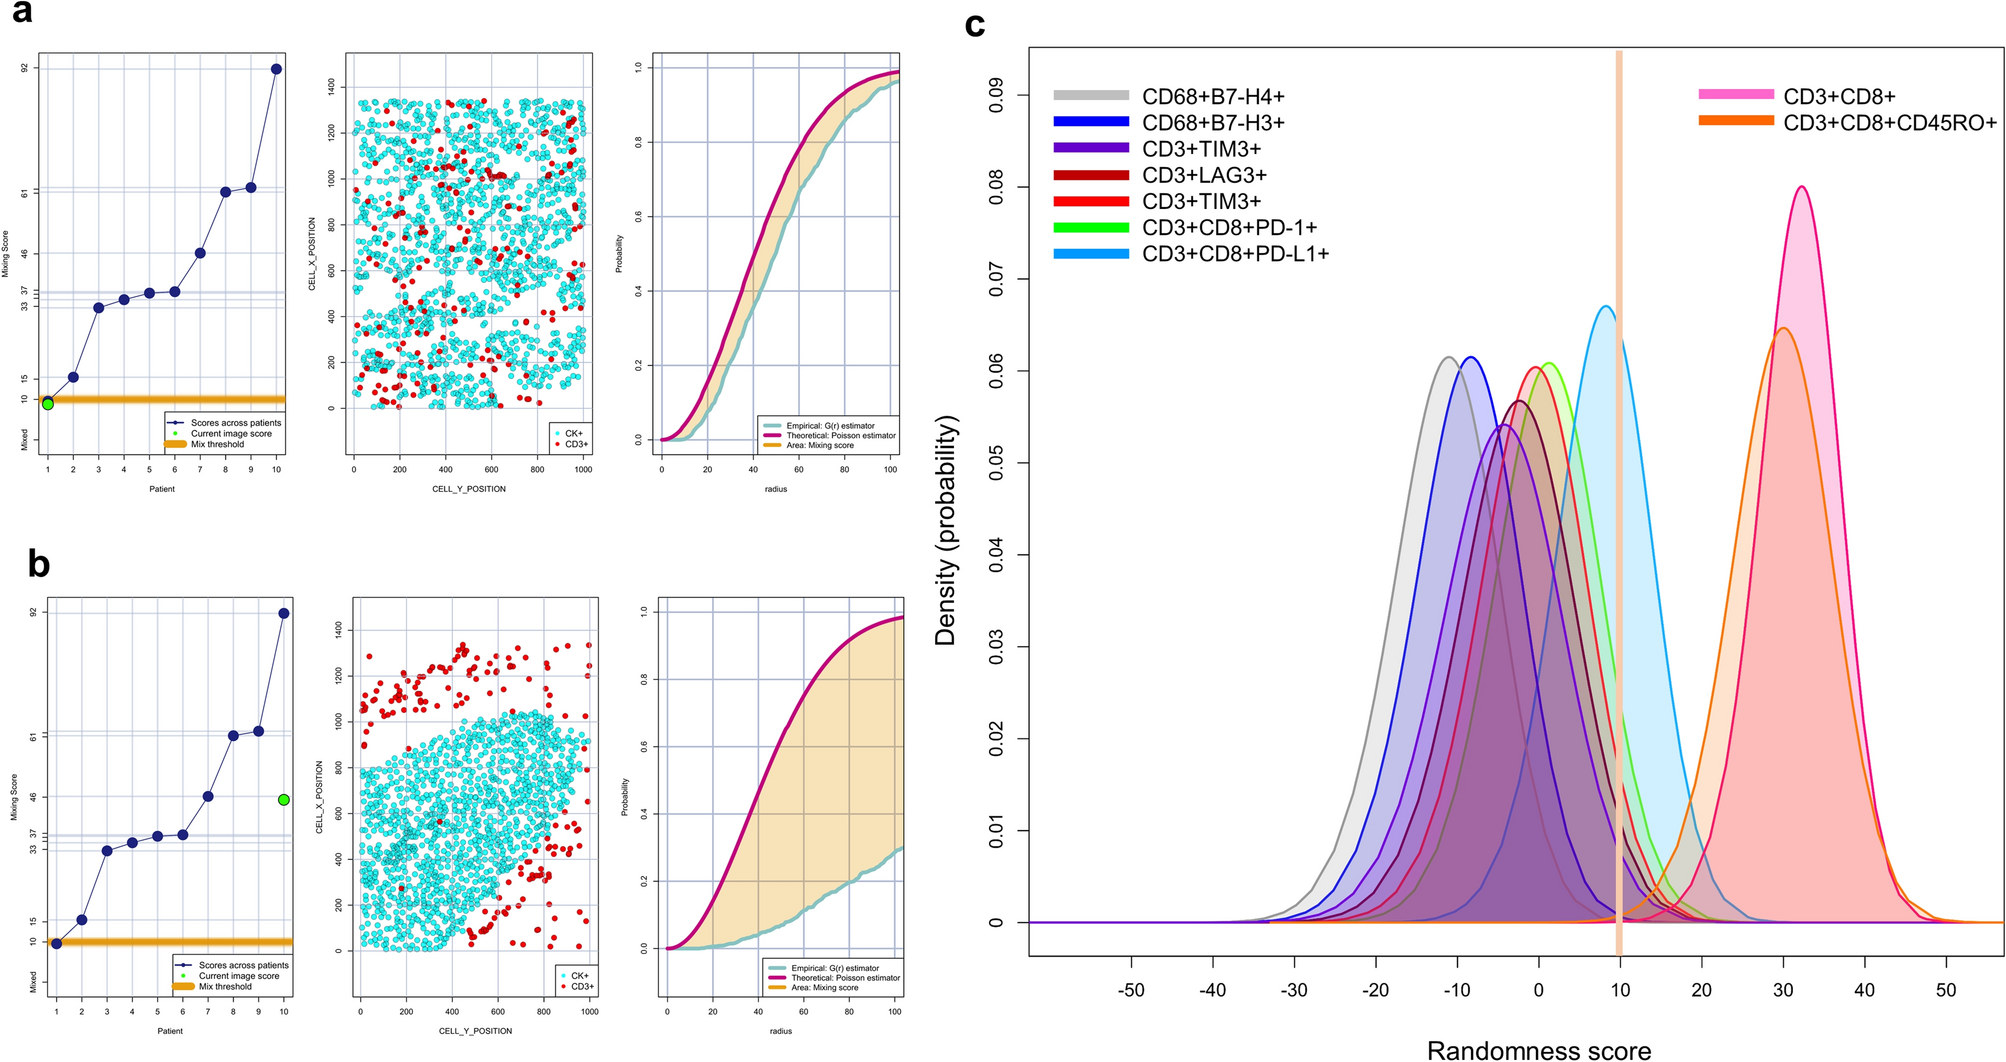
Through single nearest neighbor distance G function and theoretical Poisson curve mapping, the distance distribution patterns between CK+ malignant cells and CD3+T cells were analyzed, and the main cell phenotypes corresponding to each pattern were displayed. Both figures a and b consist of three parts: the left side shows the scoring criteria and thresholds for judging mixed and non-mixed patterns, the middle shows the distribution schematic of CD3+T cells and CK+ cells, and the right side shows the comparison area of nearest neighbor distance G function and theoretical Poisson curve. Figure a shows the mixed pattern distribution of CD3+T cells relative to CK+ cells, while figure b shows the non-mixed pattern distribution. Figure c uses a graphical model to show the interaction characteristics of two cell types, with inhibitory cell phenotype scores < 10 showing mixed patterns and closer interactions with malignant cells. Cytotoxic T cells CD3+CD8+ and cytotoxic memory T cells CD3+CD8+CD45RO+ have scores > 10, showing non-mixed patterns and weaker interactions with malignant cells. This finding provides a key basis for analyzing cell interaction mechanisms in the tumor microenvironment and their associations with tumor progression.
4. Summary
This study provides a technical solution for efficient and precise analysis of the tumor immune microenvironment by optimizing automated mIF panels and analysis workflows, while identifying potential targets such as B7-H4 and OX40 and characteristic spatial distribution patterns in NSCLC, providing important basis for personalized immunotherapy strategy development. Despite limitations such as small sample size and insufficient reproducibility validation, the technical paradigm and research findings established in this study have important reference value for basic research and clinical translation in the field of tumor immunology.
References
Parra ER, Ferrufino-Schmidt MC, Tamegnon A, Zhang J, Solis L, Jiang M, Ibarguen H, Haymaker C, Lee JJ, Bernatchez C, Wistuba II. Immuno-profiling and cellular spatial analysis using five immune oncology multiplex immunofluorescence panels for paraffin tumor tissue. Sci Rep. 2021 Apr 19;11(1):8511. doi: 10.1038/s41598-021-88156-0. PMID: 33875760; PMCID: PMC8055659.
EnkiLife mIHC TSA Kits
Product | Catalog Number |
|---|---|
TSA Six-Label Seven-Color Multiplex Immunohistochemistry Kit | |
TSA Five-Label Six-Color Multiplex Immunohistochemistry Kit | |
TSA Four-Label Five-Color Multiplex Immunohistochemistry Kit | |
TSA Three-Label Four-Color Multiplex Immunohistochemistry Kit | |
TSA Two-Label Three-Color Multiplex Immunohistochemistry Kit |