Literature Sharing: Characterization of Tumor Immune Microenvironment by Multiplex Immunofluorescence
Background
The cellular composition, functional status, and spatial distribution of the tumor immune microenvironment (TME) are core factors determining tumor progression and immunotherapy efficacy. Precise analysis of TME characteristics has become a key direction in tumor research. However, traditional research tools have significant limitations: single immunohistochemistry (IHC) can only detect a single target, failing to show intercellular interactions; flow cytometry enables multiparametric analysis but requires cell dissociation, losing crucial spatial information; early multiplex fluorescence staining techniques were limited by low signal intensity and poor antibody species compatibility, making them difficult to meet clinical sample analysis needs. Against this backdrop, a multiplex immunofluorescence (mIHC) platform based on tyramide signal amplification (TSA) technology has emerged, providing the possibility for "panoramic" analysis of TME. The team of Viratham Pulsawatdi A published a study titled "A robust multiplex immunofluorescence and digital pathology workflow for the characterisation of the tumour immune microenvironment" in Molecular Oncology. This study took colorectal cancer (CRC) formalin-fixed paraffin-embedded (FFPE) tissues as research objects, and based on the Opal multiplex immunofluorescence platform of TSA technology, constructed and verified a standardized workflow from staining to image analysis, providing a reliable method for precise characterization of tumor immune microenvironment. The following is an in-depth analysis from the aspects of technical essence, experimental logic, core findings and application value.
Viratham Pulsawatdi A team published a study titled "A robust multiplex immunofluorescence and digital pathology workflow for the characterisation of the tumour immune microenvironment" in Molecular Oncology. This study took colorectal cancer formalin-fixed paraffin-embedded tissues as research objects, and based on the Opal multiplex immunofluorescence platform of TSA technology, constructed and verified a standardized workflow from staining to image analysis, providing a reliable method for precise characterization of tumor immune microenvironment. The following is an in-depth analysis from the aspects of technical essence, experimental logic, core findings and application value.
I. Technical Core: Principles and Advantages of Multiplex Immunofluorescence TSA Technology
TSA technology is the core of achieving high-sensitivity detection in mIHC. Its principle is based on horseradish peroxidase (HRP) catalytic reaction: HRP binds to primary antibody, then catalyzes the oxidative polymerization of tyramide molecules, enabling efficient enrichment of fluorescent signals at antigen sites and achieving signal amplification. Compared with traditional IHC, this technology breaks through the following bottlenecks:
Feasibility of Multiplex Labeling: Through the cyclic process of "primary antibody binding-signal amplification-antigen denaturation" , 6-8 biomarkers can be sequentially detected on the same tissue section, solving the limitation of traditional IHC which can only detect a single target at a time.
High Sensitivity: The detection ability for low-expression biomarkers is significantly better than traditional fluorescence staining, with signal intensity reaching 10-100 times that of traditional methods.
Same Species Antibody Compatibility: The signal amplification of TSA does not depend on the antibody source species, and multiple primary antibodies from the same species can be used, greatly expanding the flexibility of antibody selection.
In this study, Opal dye, as the core carrier of TSA technology, achieves precise differentiation of multiple signals through matching with different fluorescence channels and combining with multispectral imaging and unmixing technology, laying a foundation for subsequent digital analysis.Compared with single-staining IHC, flow cytometry and other technologies, the multiplex immunofluorescence TSA technology adopted in this study shows unique advantages:
Spatial Information Preservation: While detecting multiple biomarkers, the tissue morphology and cellular spatial localization relationships are completely preserved, which cannot be achieved by flow cytometry and is crucial for analyzing tumor immune cell infiltration patterns.
Quantitative Accuracy: Combined with the digital image analysis software QUPATH, quantitative statistics of immune cell phenotypes can be performed, with a correlation coefficient ofrₛ>0.9 with traditional IHC, verifying its quantitative reliability.
High-throughput Compatibility: Through automated stainers and whole-slide scanners, automated operation from staining to imaging is realized. A single sample can be completed from tissue section to result output within 24 hours, suitable for large sample cohort studies.
II. Experimental Design
The study targeted key issues in mIHC experiments such as "unstable staining quality" and "easy deviation in image analysis" , and designed two multiplex detection panels to systematically optimize and verify the process:
MP1 (6-plex): CD3, CD4, CD8, CD20, cytokeratin (CK), DAPI, focusing on the colocalization analysis of T cell subsets, B cells, and tumor cells.
MP2 (5-plex): CD4, CD68, FOXP3, CK, DAPI, used to analyze the infiltration characteristics of regulatory T cells (Treg) and macrophages.
III. Results Presentation
1. Staining Sequence Optimization
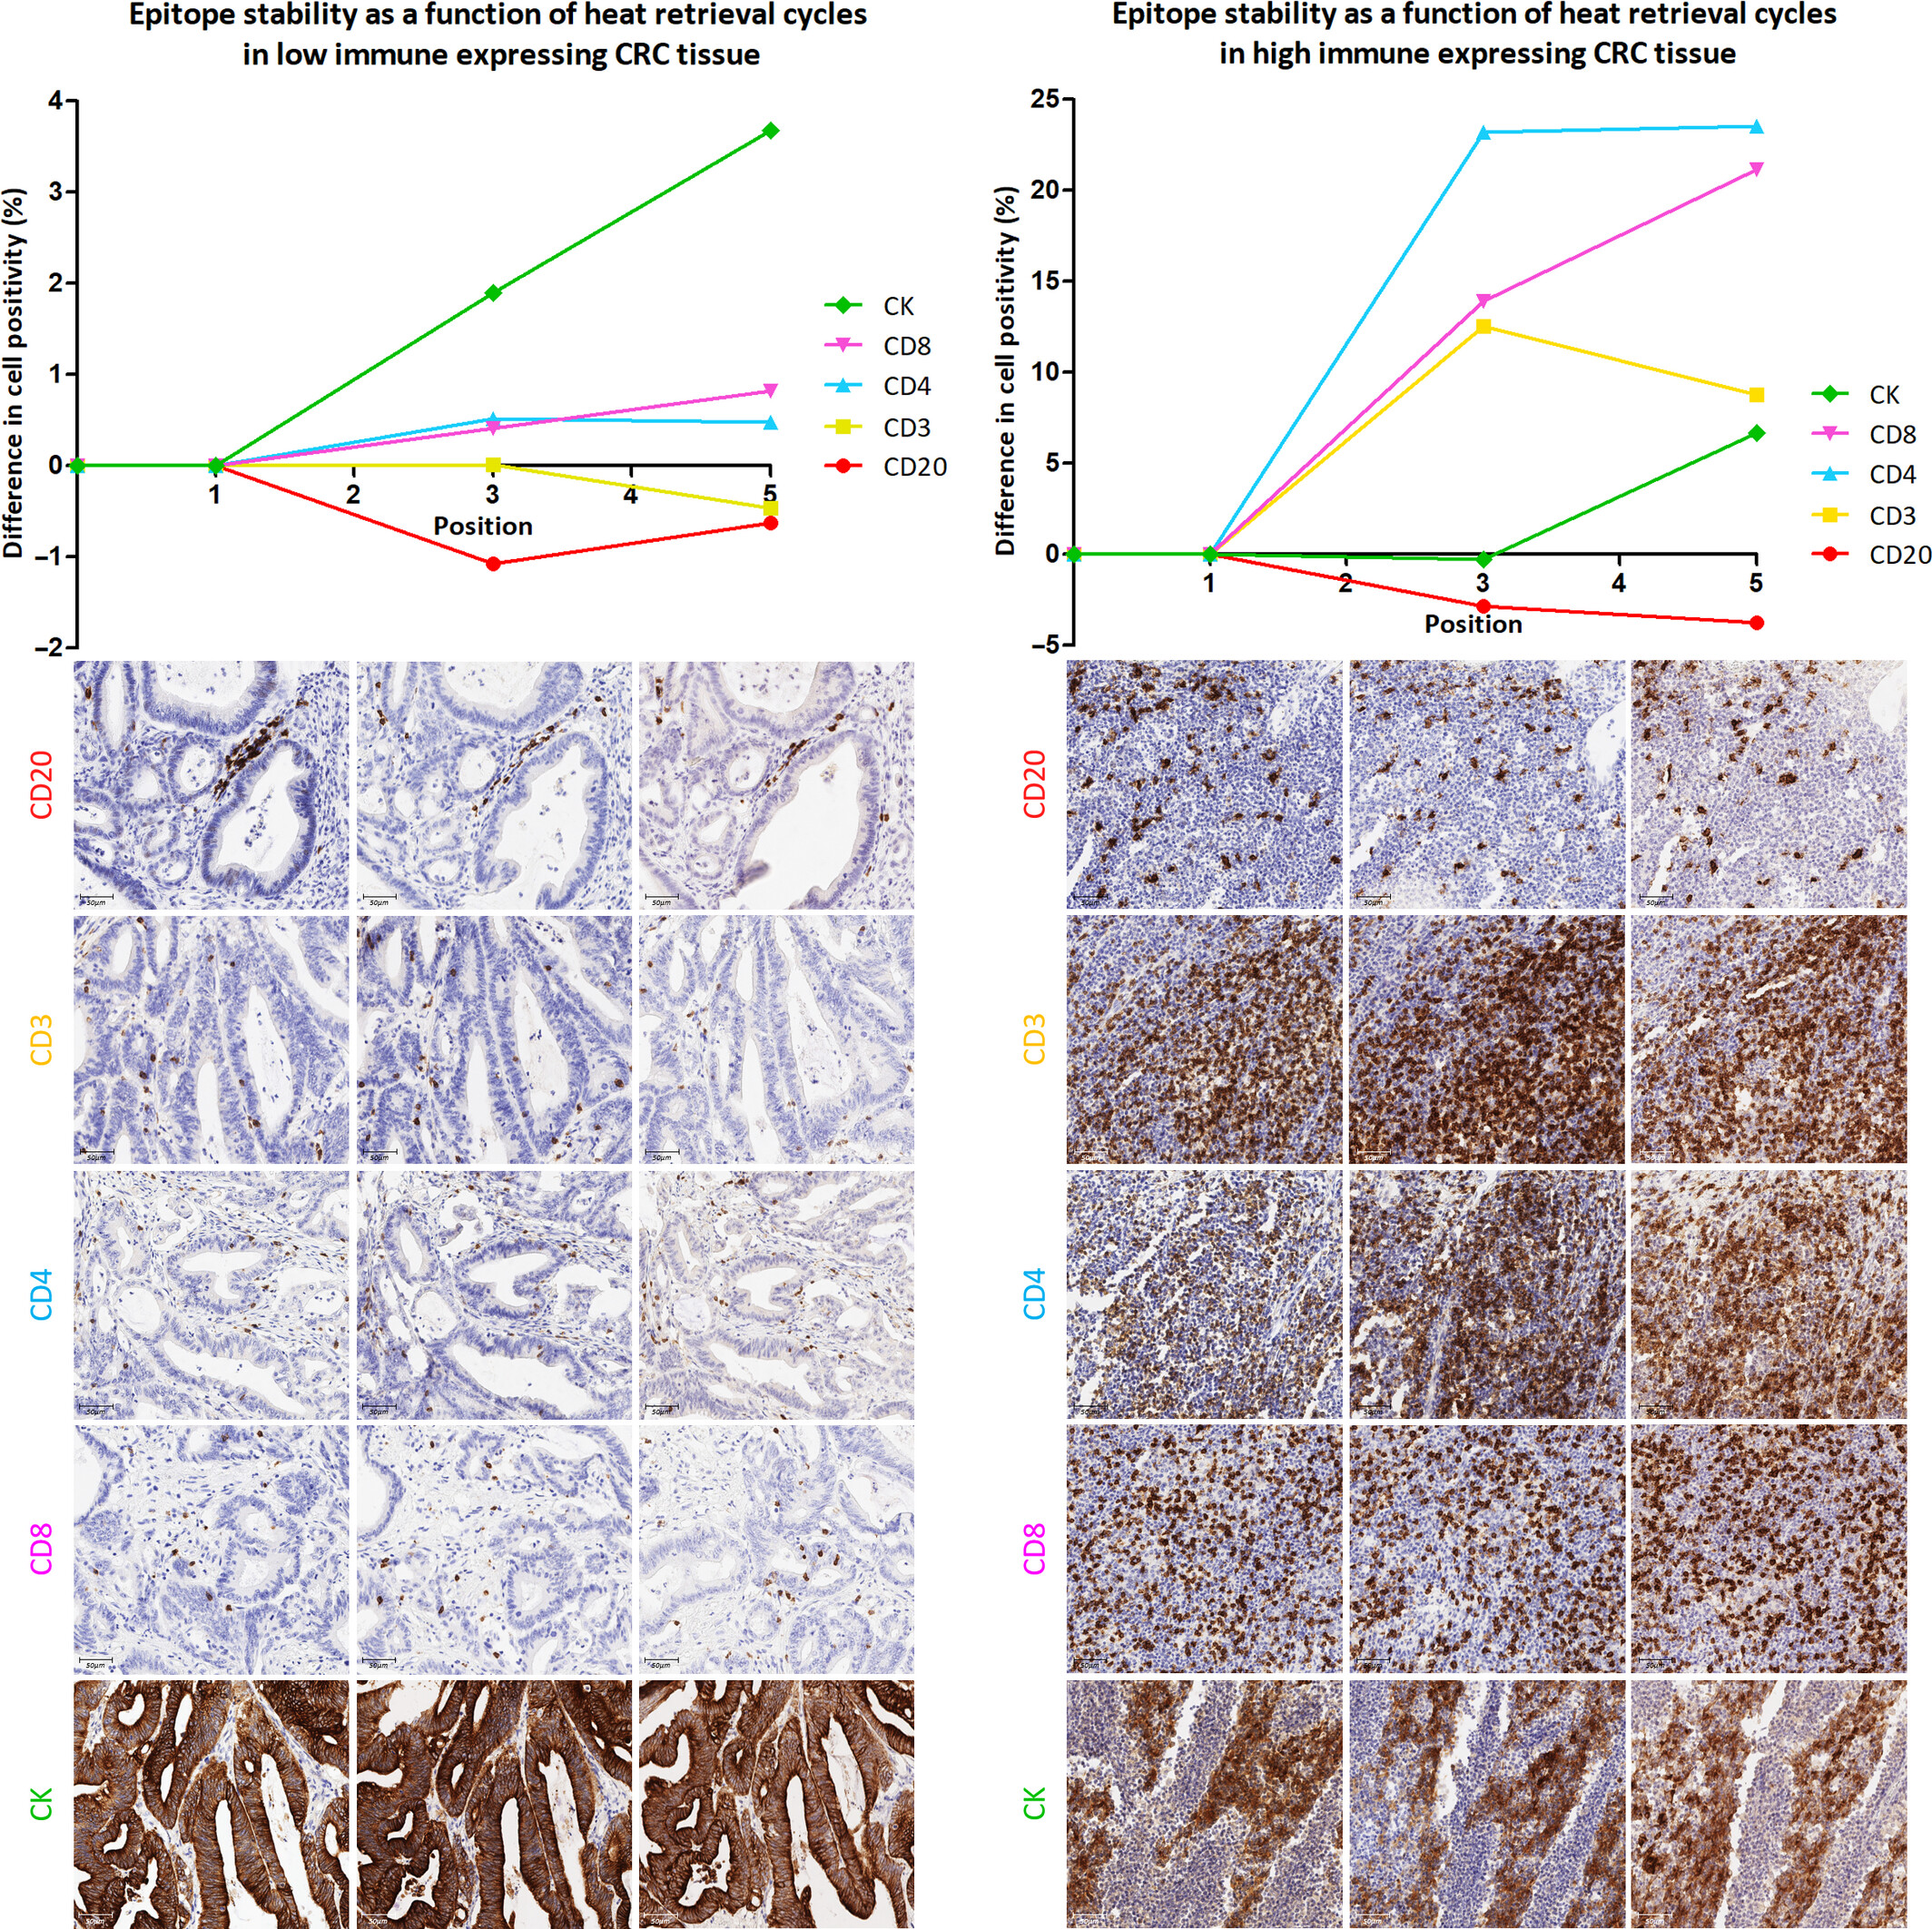
Systematic comparison of the detection rates of positive cells for 5 biomarkers including CD20 and CD3 after repeated heat-induced epitope retrieval (HIER) in colorectal cancer tissues with low and high immune infiltration.
Results showed: a. Significant differences in epitope stability: CD20 epitope has the highest stability, no need for multiple HIER repairs, with stable detection rate in the first time; CD3 epitope stability is second, suitable for 2 HIER repairs; CD4, CD8, and CK epitopes need multiple HIER to be fully exposed. b. Small impact of immune infiltration level: In low/high immune infiltration CRC tissues, the epitope stability trend of each biomarker is consistent, indicating that the optimization results have universal applicability. c. Staining position correlates with detection effect: CD20 detection rate decreases after multiple HIER, indicating that the epitope has been denatured; CD4 detection rate reaches the peak after the 5th HIER repair, indicating that the epitope is fully exposed after multiple HIER.
This experiment clarified the optimal staining sequence for each antibody in MP1, solved the core problem of "epitope degradation with HIER cycles" in multiplex staining, provided a direct basis for the subsequent cyclic process design of fluorescence staining, and avoided false negative results caused by improper staining sequence.
2. Validation of Fluorescence Staining Effectiveness
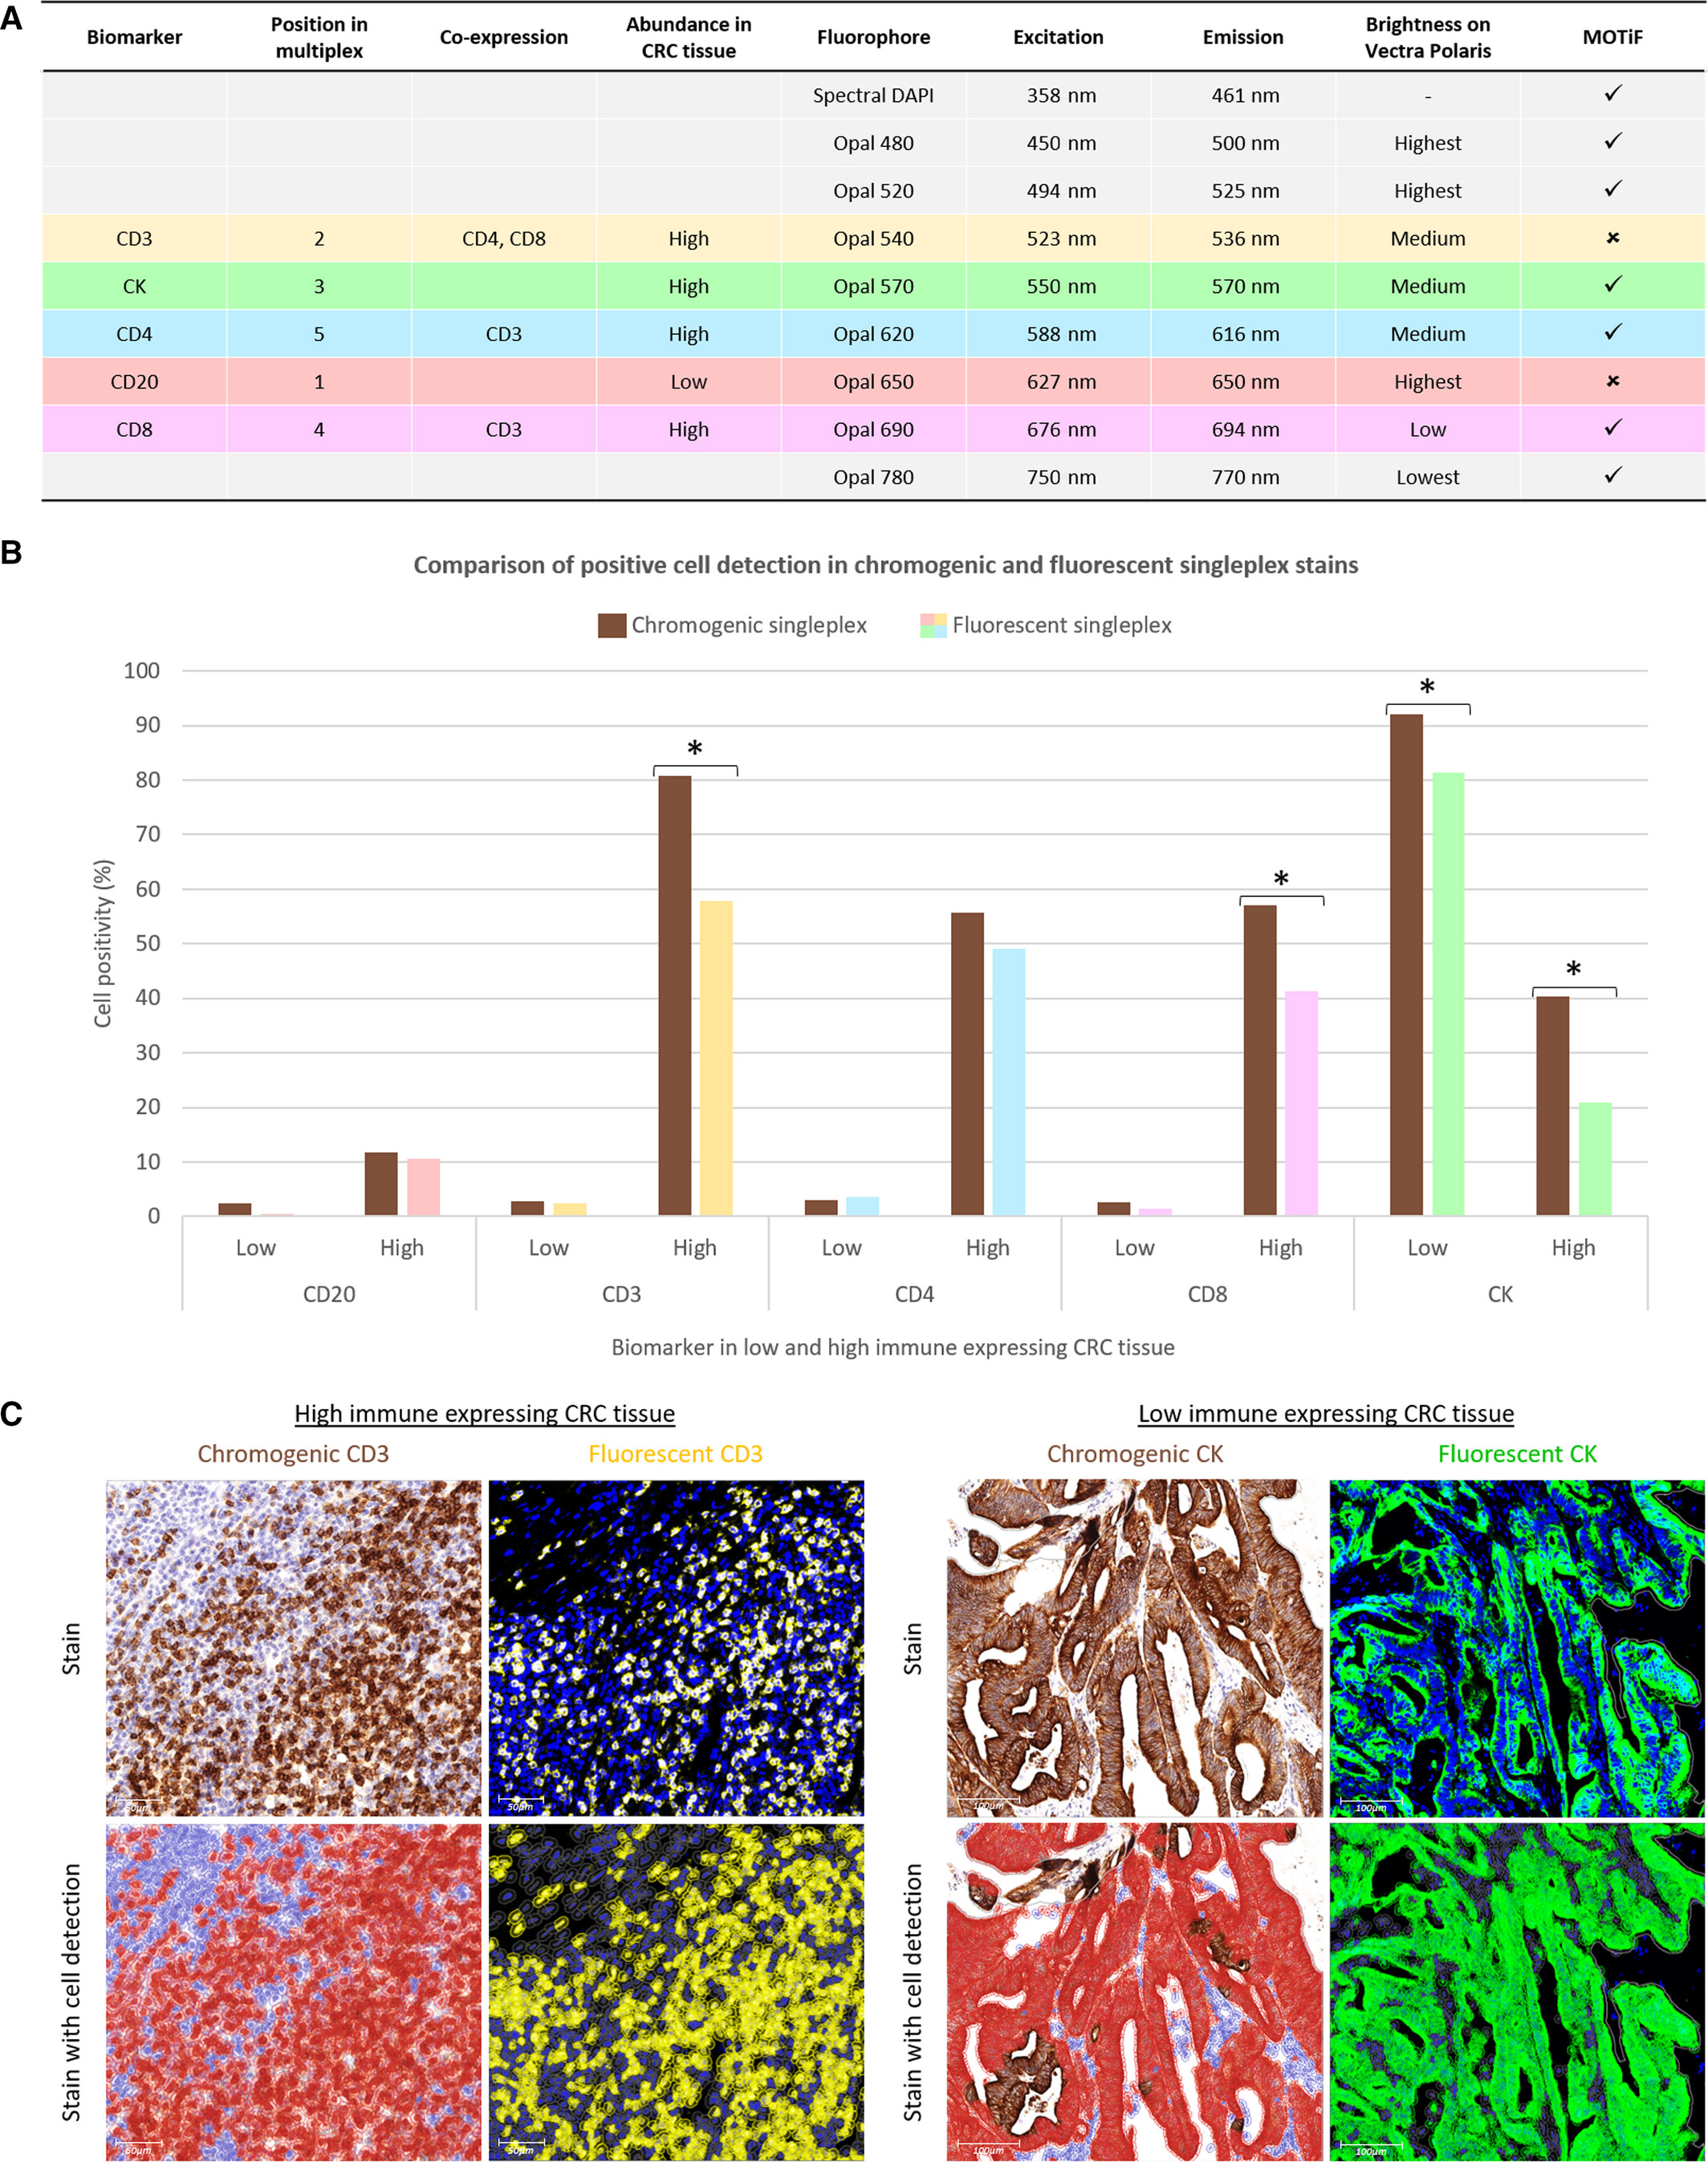
The experiment verified the effectiveness of fluorescence single staining technology from three aspects: Firstly, according to the antibody-Opal dye pairing table, the strategy of matching low-abundance biomarkers (such as CD20) with high-brightness dyes and high-abundance biomarkers (such as CD3, CK) with medium-low brightness dyes was adopted to balance signal intensity, and at the same time, functional-related biomarkers (such as CD3 and CD4/CD8) were paired with dyes with high spectral separation to avoid signal crosstalk; Secondly, the bar chart shows that the detection results of 5 biomarkers in low/high immune infiltration colorectal cancer tissues are highly consistent between this technology and traditional DAB chromogenic immunohistochemistry; Thirdly, representative area photos show that traditional DAB staining is difficult to achieve accurate cell segmentation due to dense cells, while fluorescence staining signals have clear boundaries, and software can be used to accurately determine cell positivity/negativity. In summary, fluorescence single staining technology can replace traditional immunohistochemistry for biomarker detection, and has more advantages in quantitative analysis of dense cell regions, providing data support for the reliability of subsequent multiplex fluorescence staining.
3. Interference Elimination and Process Establishment of Multiplex Staining
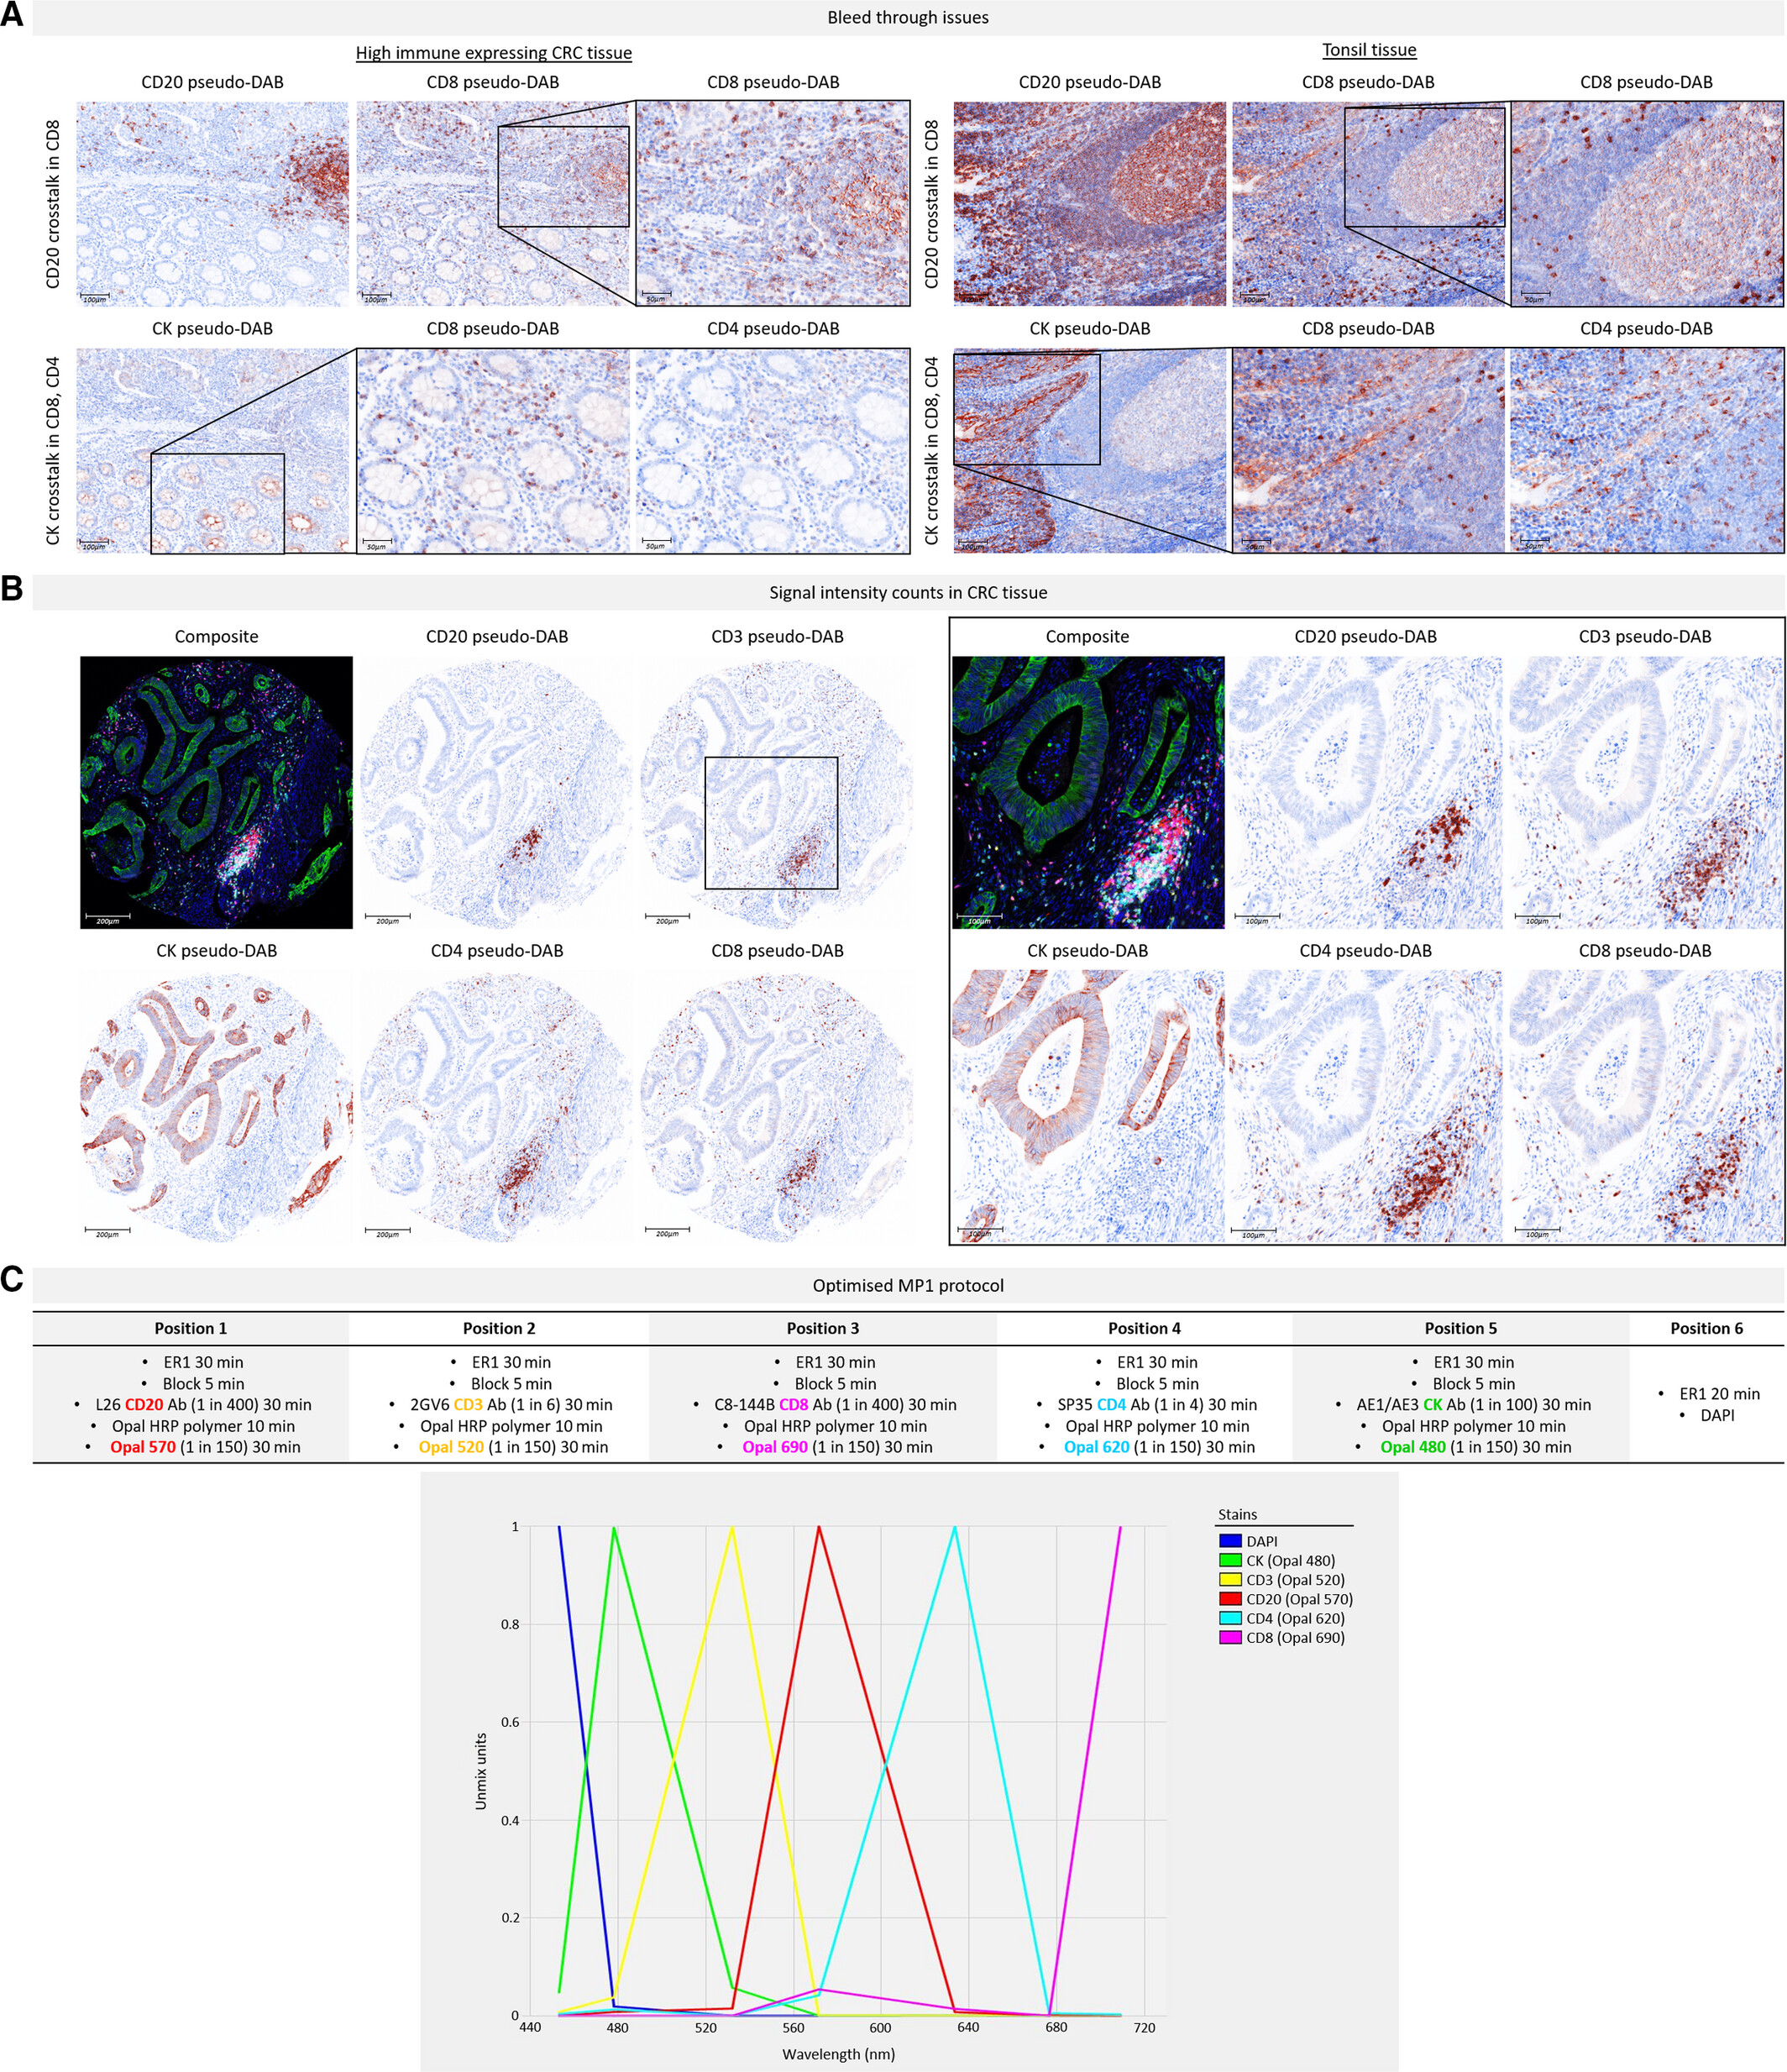
Figure A shows obvious signal interference of CD20 on CD8 and CK on CD4/CD8 before optimization. The reasons include spectral overlap caused by CD20-Opal 650 and CD8-Opal 690 both belonging to the Cy5 channel, and epitope cross-reaction caused by adjacent staining positions of CK and CD8. Control experiments excluded interference from incomplete antibody stripping. Through optimization measures such as adjusting Opal-antibody pairing, rearranging staining sequence (avoiding CK and CD4/CD8 being adjacent), and using ER1 mild stripping solution, signal crosstalk was completely eliminated. In optimized Figure B, the signal intensity of each biomarker is in the optimal range of 20-25 counts. The MOTIF Opal dye used has no spectral overlap and scanning speed is increased by 20 times, which can meet the needs of high-throughput sample analysis.
This experiment systematically solved the three core problems of spectral crosstalk, epitope cross-reaction and background interference in multiplex fluorescence staining. The MP1 experimental process established after 9 rounds of optimization and verification with 40 slices provides a stable and reliable standardized scheme for subsequent high-throughput experiments.
4. Parameter Optimization for High-throughput Imaging
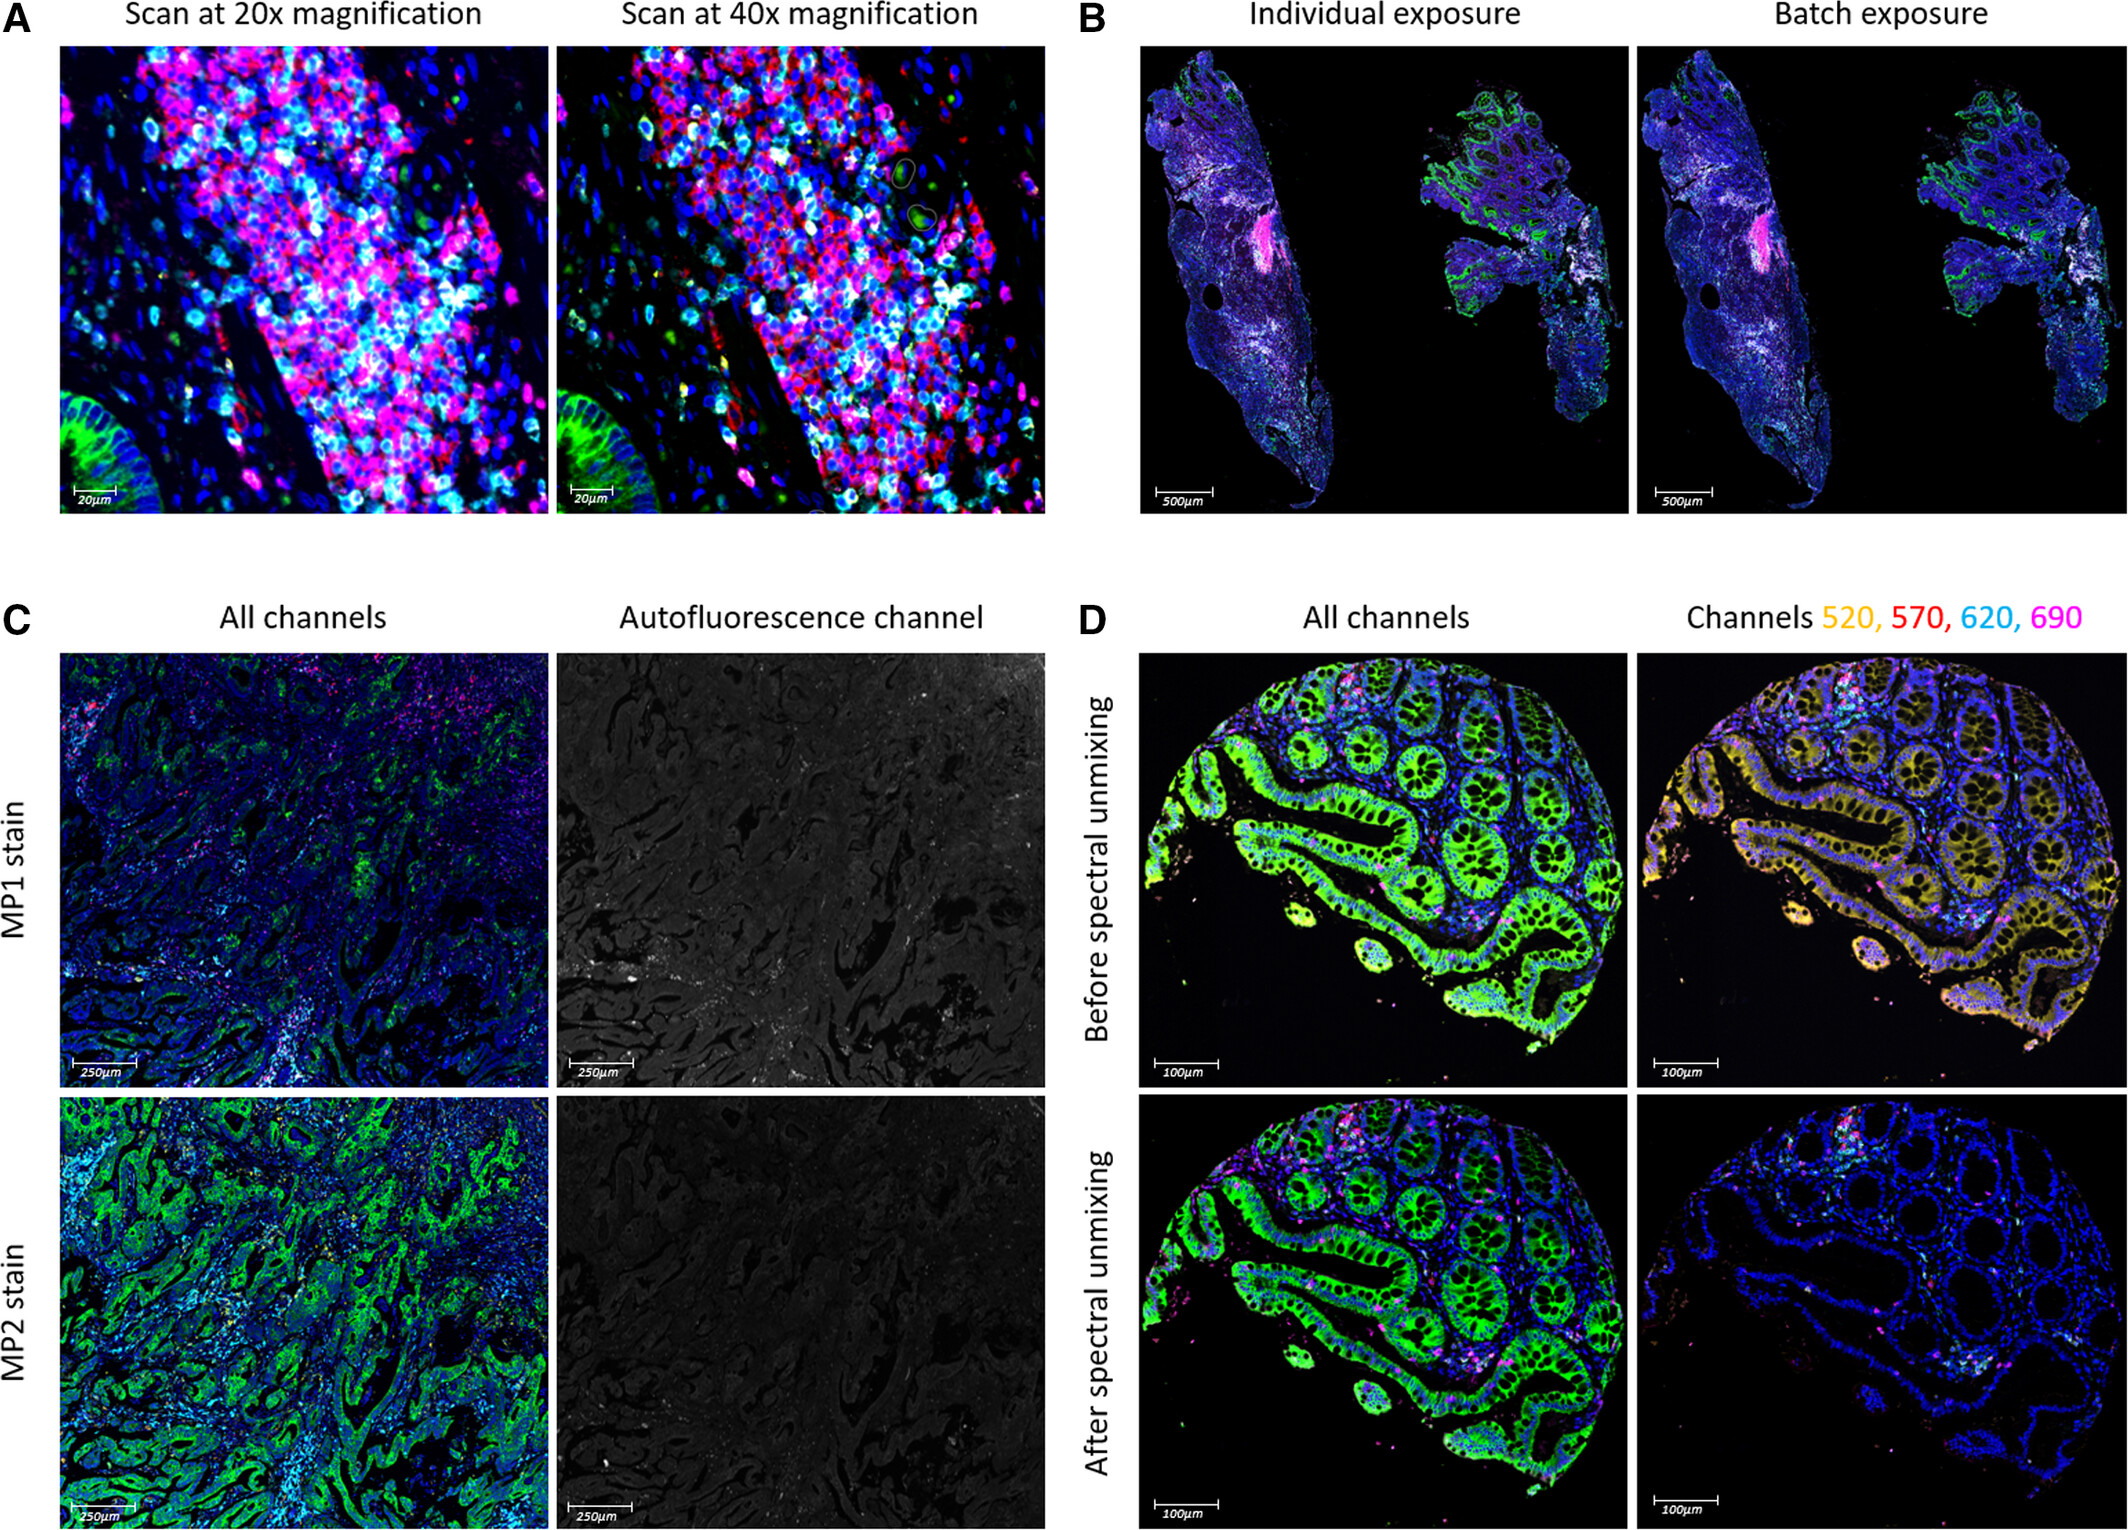
Figure A compares the scanning effects of colorectal cancer tissues at 20x and 40x, finding that the difference in cell population detection rate at 20x scanning is less than 1%, and the scanning time is significantly shortened, so 20x is determined as the standard imaging magnification. B is the comparison of staining effects between independent exposure and batch exposure of a single slice, finding that there is no significant difference in staining intensity between independent exposure and batch exposure (correlation coefficient rₛ>0.9, P<0.05), and batch exposure mode can greatly reduce imaging preparation time, suitable for high-throughput sample processing. C is a comparison chart of colorectal cancer tissues with MP1 and MP2 staining schemes. Results show that MP1 slices have enhanced autofluorescence due to larger thickness, and CK and CD4 signal intensities are weaker than MP2 slices, thus proving that 3-4μm is the optimal slice thickness. D is a comparison chart of colon tissues before and after spectral decomposition, clearly showing the signal separation effect of CK (green) and CD3 (yellow).
5. Final Validation of Multiplex Fluorescence Staining Process
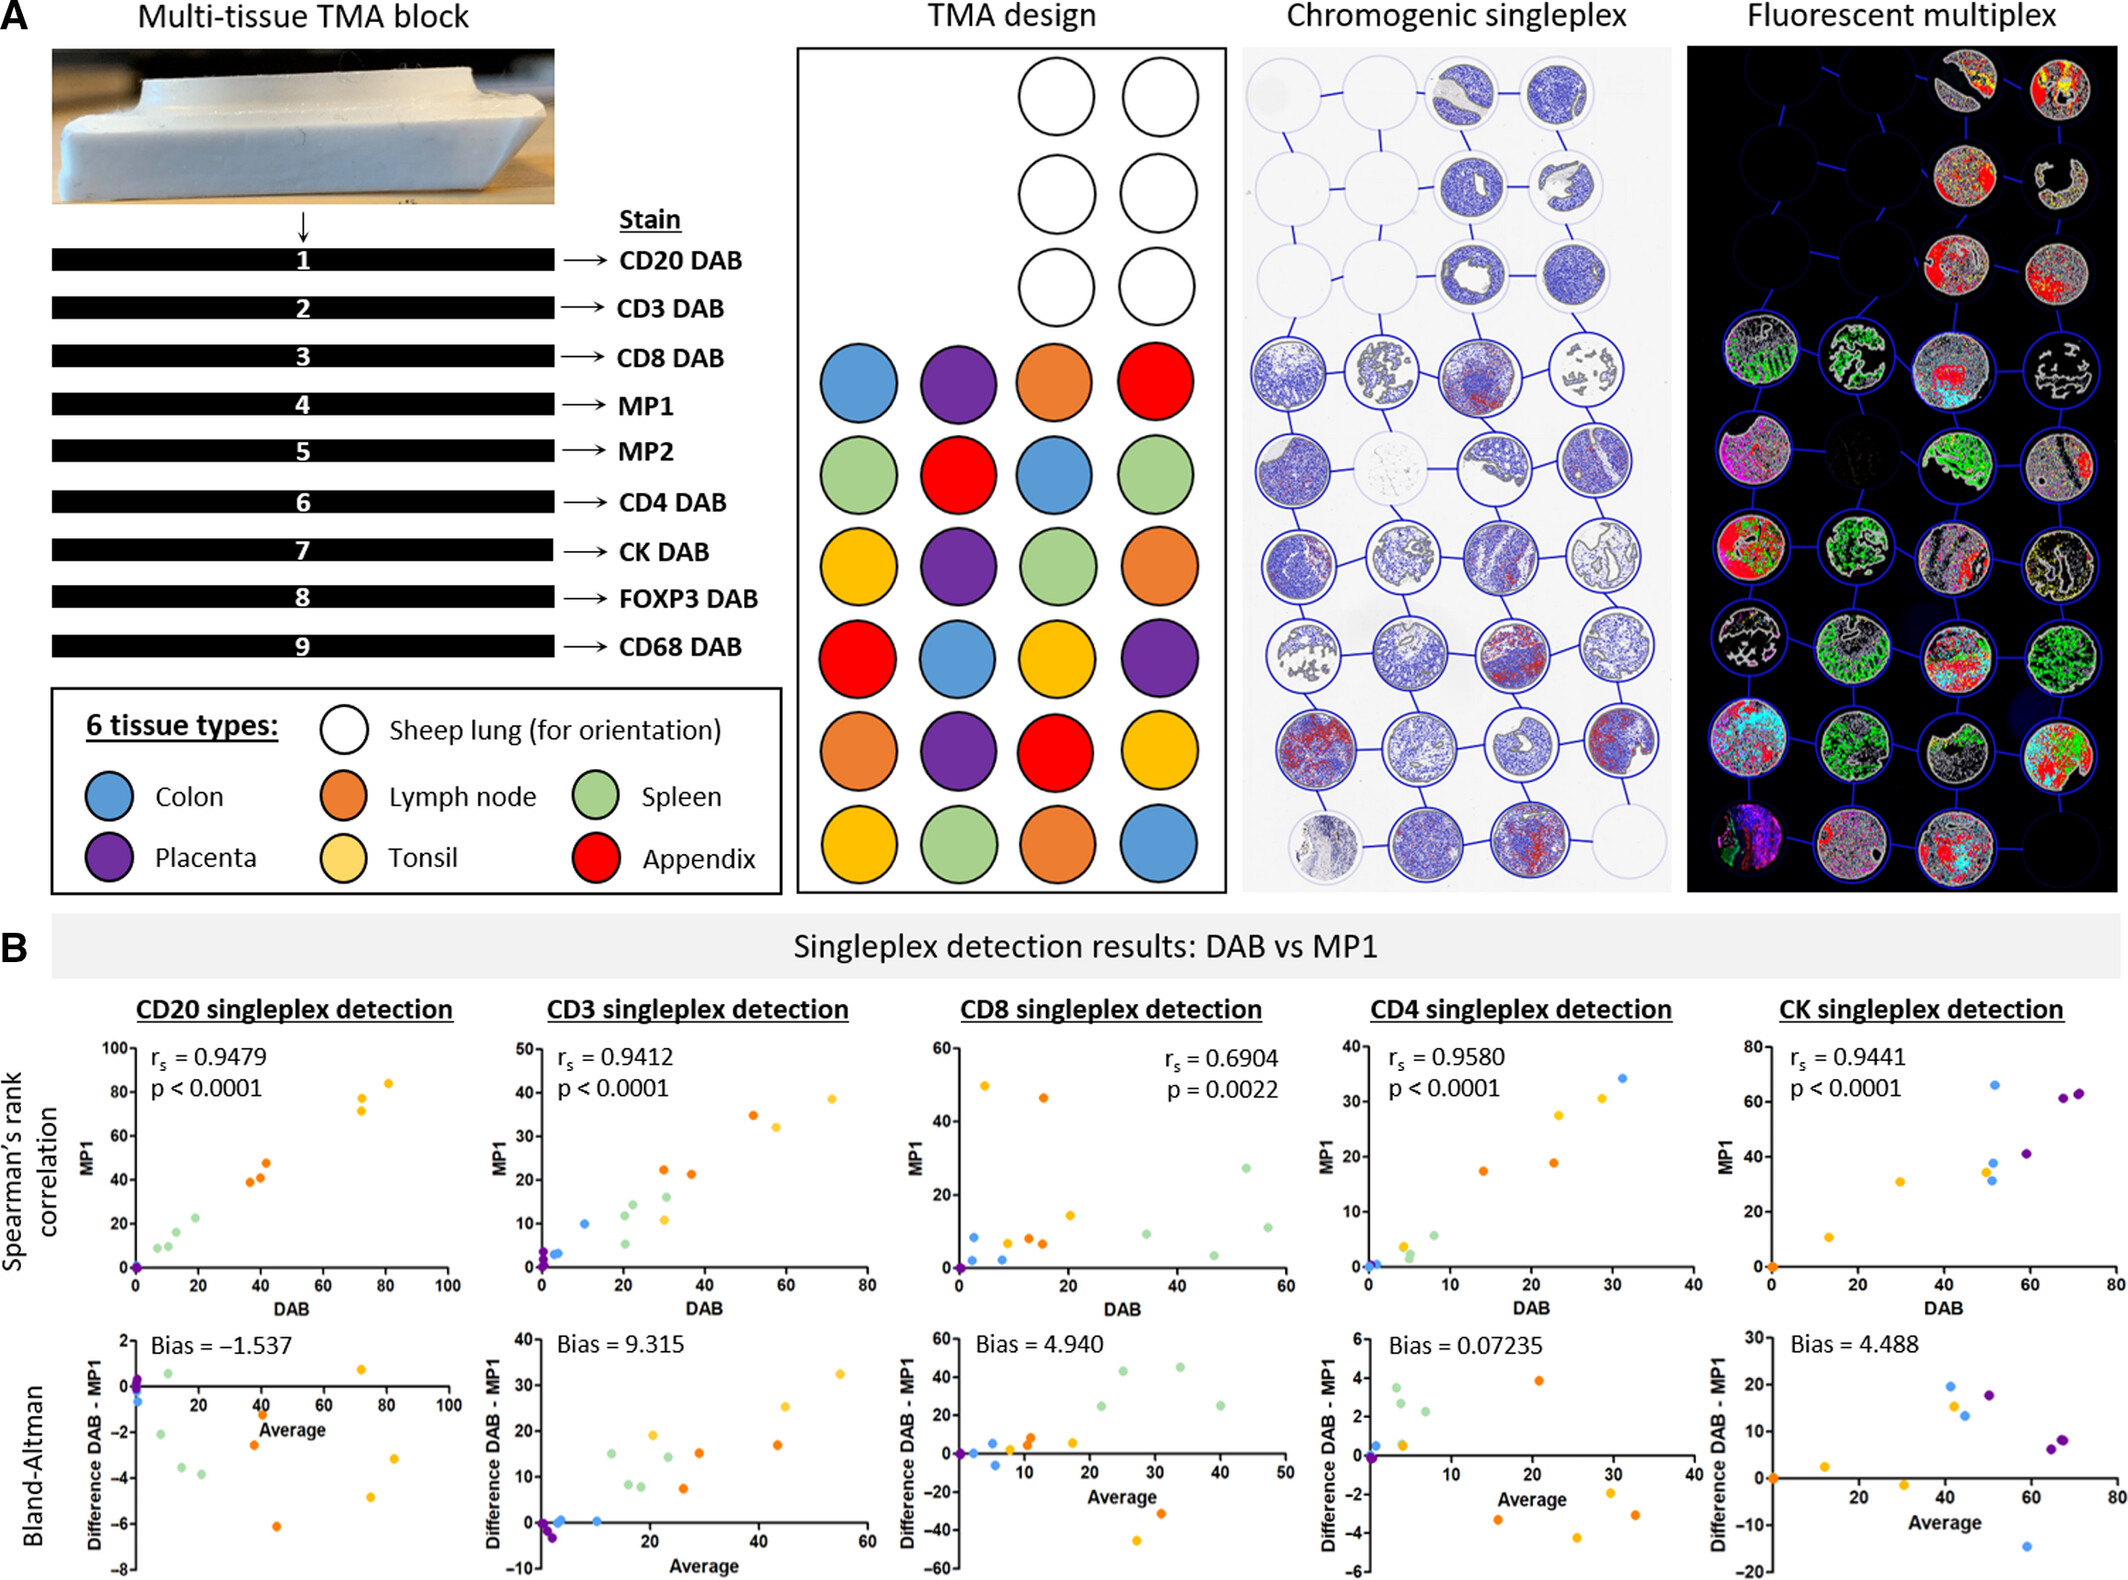
Figure A shows the processing scheme for 9 consecutive slices (7 for traditional DAB single-label immunohistochemistry, 2 for multiplex fluorescence staining) and chip layout (including 6 normal tissues and sheep lung positioning tissue). B systematically compares the detection results of each biomarker in the two detection methods through Spearman correlation analysis and Bland-Altman consistency analysis. Detection results show that except for CD8 (unstable epitope in some tissues) and FOXP3 (expression level <0.5%), the correlation coefficients rₛ of the other biomarkers in the two detection methods are all >0.9 (P<0.0001), and the detection deviations of all biomarkers are within the 95% consistency limit, confirming that multiplex fluorescence staining has no systematic deviation and has high consistency and good correlation with traditional immunohistochemistry. As core validation data, this figure confirms the reliability of MP1 and MP2 experimental processes from three dimensions: multiple tissue types, multiple biomarkers, and quantitative consistency.
6. MP1 Detection Sequence Impact on Phenotype Analysis
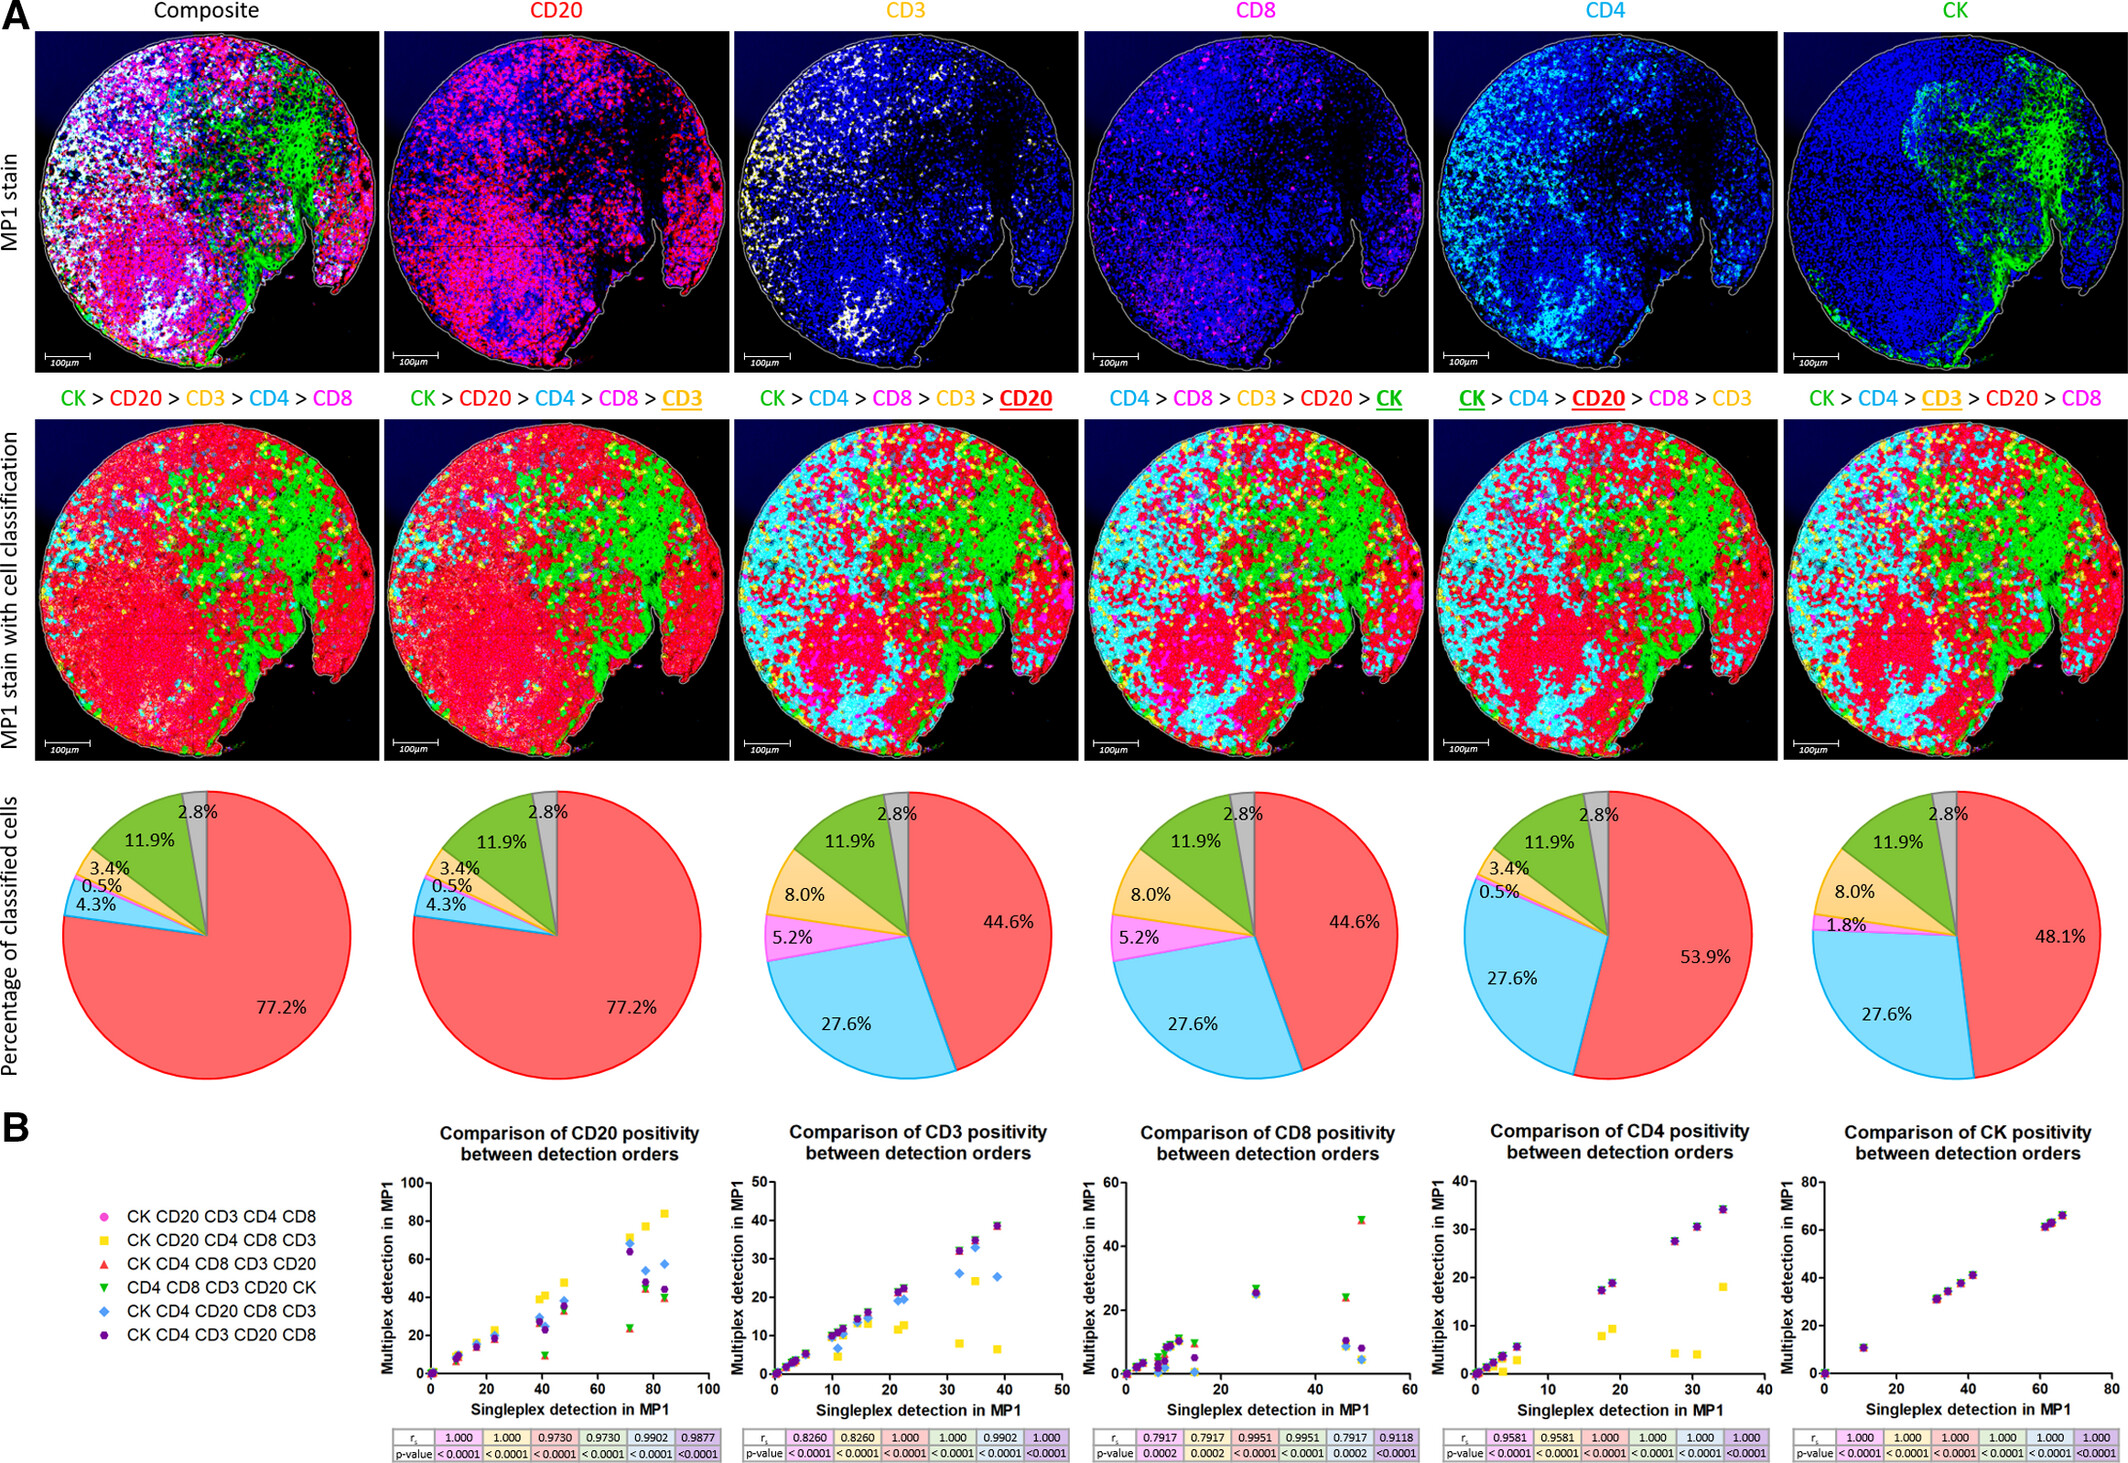
Figure A shows the MP1 staining of tonsil tissue chip, synchronously presenting phenotype classification pie charts, original staining images, and cell classification images under 6 detection sequences. Scatter plots quantitatively compare the correlation between different detection sequences and single-label results. The study found that detection sequence has a significant impact on analysis results. Prior detection of high-expression biomarker CD20 will mask the signal of adjacent low-expression biomarker CD8, resulting in overestimation of CD20 positivity rate and underestimation of CD8 positivity rate. The final established optimal detection sequence "CK>CD4>CD3>CD20>CD8" follows the logic of "first non-immune cell biomarkers, then by the hierarchy of pan-immune cells→T cell subsets→B cells, and placing easily interfering biomarkers last". Its phenotype classification results are highly consistent with the original staining, and the analysis results of each biomarker have a correlation of rₛ>0.9 (P<0.0001) with single-label results. This figure first clarifies the core role of detection sequence in multiplex fluorescence digital analysis, establishes detection sequence principles based on cell type hierarchy, and effectively solves phenotype classification errors caused by improper analysis methods.
7. From Staining to Digital Image Analysis
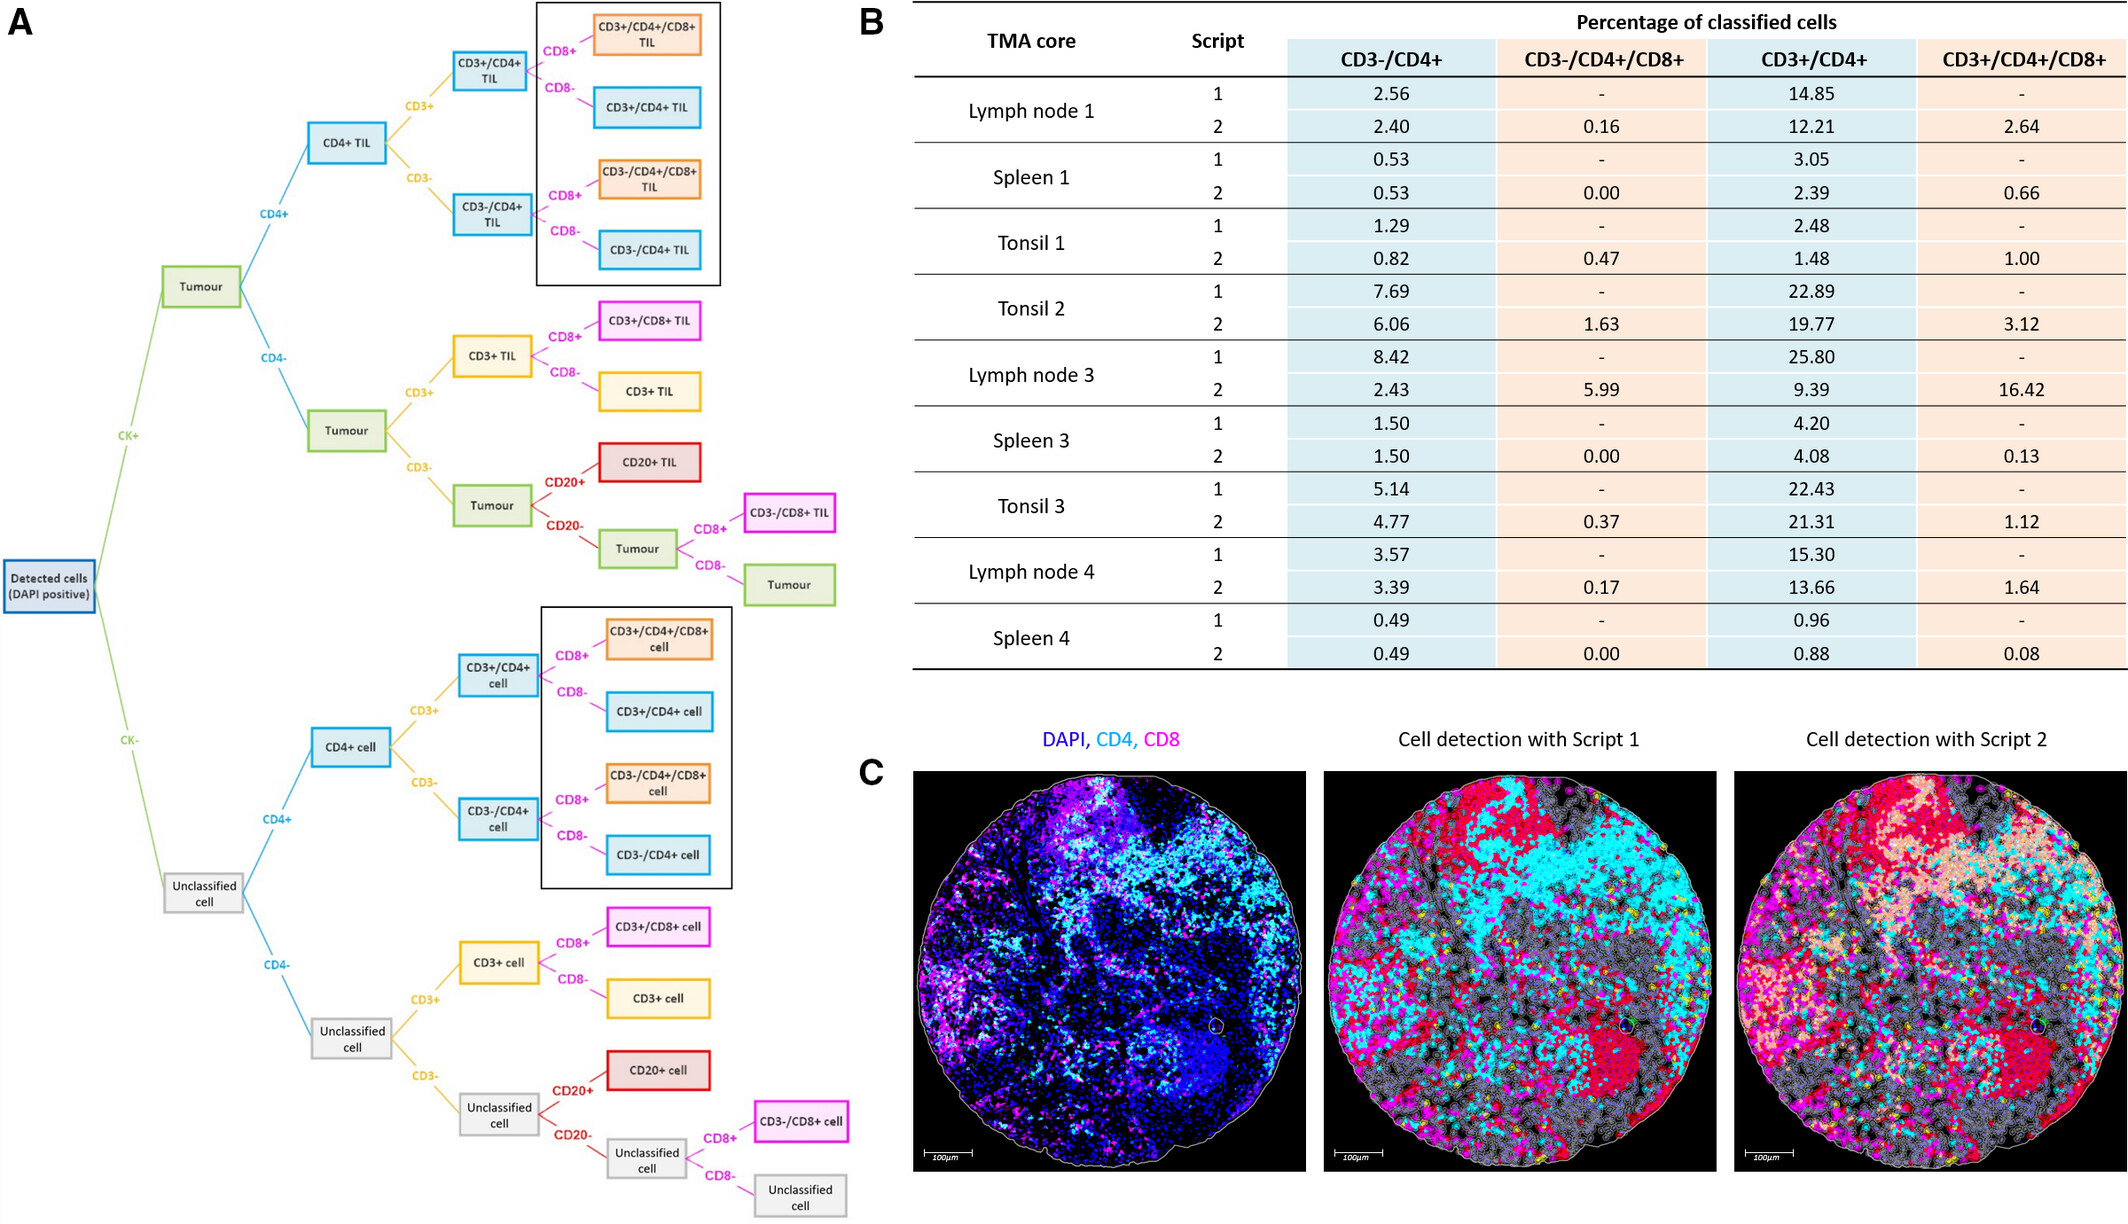
This classification decision tree follows the hierarchical logic of "nuclear recognition→CK negative screening→CD3 typing→CD4/CD8 subdivision", ensuring the clarity of cell definition. The study achieved comprehensive coverage of expected and unexpected phenotypes through customized analysis scripts, solving the problem of phenotype missed judgment in digital analysis. The newly discovered CD4⁺/CD8⁺ double-positive cell subset provides new clues for colorectal cancer immune microenvironment research, highlighting the unique advantages of multiplex fluorescence staining technology in mining new biomarkers.
IV. Summary
Through systematic optimization and verification, this study constructed a reliable multiplex immunofluorescence TSA technology workflow, which not only confirmed the core value of this technology in tumor immune microenvironment research, but also provided a practical path for its standardization and clinical transformation. The core insight is that the advantages of multiplex immunofluorescence TSA technology not only stem from the high sensitivity of TSA, but also depend on the whole process control of "experimental optimization-analysis standardization-multi-dimensional verification" . In the future, with algorithm iteration and technology integration, this technology will realize more extensive value implementation in the field of "precision medicine" , providing strong support for disease mechanism research and clinical diagnosis and treatment decision-making.
References
Viratham Pulsawatdi A, Craig SG, Bingham V, McCombe K, Humphries MP, Senevirathne S, Richman SD, Quirke P, Campo L, Domingo E, Maughan TS, James JA, Salto-Tellez M. A robust multiplex immunofluorescence and digital pathology workflow for the characterisation of the tumour immune microenvironment. Mol Oncol. 2020 Oct;14(10):2384-2402. doi: 10.1002/1878-0261.12764. Epub 2020 Sep 1. PMID: 32671911; PMCID: PMC7530793.
EnkiLife mIHC TSA Kits
Product | Catalog Number |
|---|---|
TSA Six-Label Seven-Color Multiplex Immunohistochemistry Kit | |
TSA Five-Label Six-Color Multiplex Immunohistochemistry Kit | |
TSA Four-Label Five-Color Multiplex Immunohistochemistry Kit | |
TSA Three-Label Four-Color Multiplex Immunohistochemistry Kit | |
TSA Two-Label Three-Color Multiplex Immunohistochemistry Kit |