Literature Sharing: Multiplex Immunofluorescence Identifies High Stromal CD68⁺PD-L1⁺ Macrophages
Background
In recent years, immune checkpoint inhibitor combination chemotherapy regimens have significantly improved the prognosis of some triple-negative breast cancer (TNBC) patients, but existing biomarkers have obvious limitations. Differences in antibody clone numbers in commercial PD-L1 detection kits lead to inconsistent detection thresholds, and only using "immune cell positivity rate >1%" as the judgment criterion cannot distinguish the cell types expressing PD-L1, resulting in limited accuracy in patient screening with a response rate of only 8%-20%. Therefore, using multiplex immunofluorescence TSA technology to analyze the expression characteristics of PD-L1 on different immune cells has become a key direction for optimizing TNBC patient stratification and treatment decisions.
The James Wang team published a study titled "Multiplexed immunofluorescence identifies high stromal CD68⁺PD-L1⁺ macrophages as a predictor of improved survival in triple negative breast cancer" in scientific reports. The study focused on the cell specificity of PD-L1 expression in TNBC, systematically identifying the phenotypes of immune cells expressing PD-L1 in the TNBC tumor microenvironment using multiplex immunofluorescence TSA technology, and clarifying the composition of different PD-L1-positive cell subsets. It analyzed the association between specific PD-L1-positive immune cell phenotypes and patients' overall survival and breast cancer-specific survival, and verified the incremental value of the CD68⁺PD-L1⁺ phenotype compared to single PD-L1 indicators in prognosis prediction, providing new biomarkers for risk stratification and treatment decisions in TNBC patients.
TSA Multiplex Immunofluorescence Experimental Design
The study adopted a retrospective cohort design, including 244 FFPE tissue samples from TNBC patients at St. George Hospital in Sydney, and constructed a sample library through tissue microarray (TMA) technology. A representative tissue microarray from the tumor peripheral region was selected for each sample, and normal spleen, kidney, and breast tissues were included as internal reference controls. Using TSA-based Opal multiplex staining technology, 8 core markers were selected to construct detection channels, covering T cells (CD3, CD8), B cells (CD20), macrophages (CD68), immune checkpoint molecules (PD-1, PD-L1), regulatory T cells (FOXP3), and tumor cells (Pan-CK, pancytokeratin). The experimental process included: tissue section dewaxing and rehydration, antigen retrieval, primary antibody incubation, HRP-labeled secondary antibody binding, TSA fluorescent substrate incubation, and finally nuclear counterstaining with DAPI. Image analysis was performed using the open-source software QuPath, combined with machine learning algorithms to complete tissue segmentation, cell identification, and phenotype identification, ultimately achieving counting and density quantification of various immune phenotype cells in the stromal region, with median cell density as the cutoff value for high/low expression.
Results Presentation
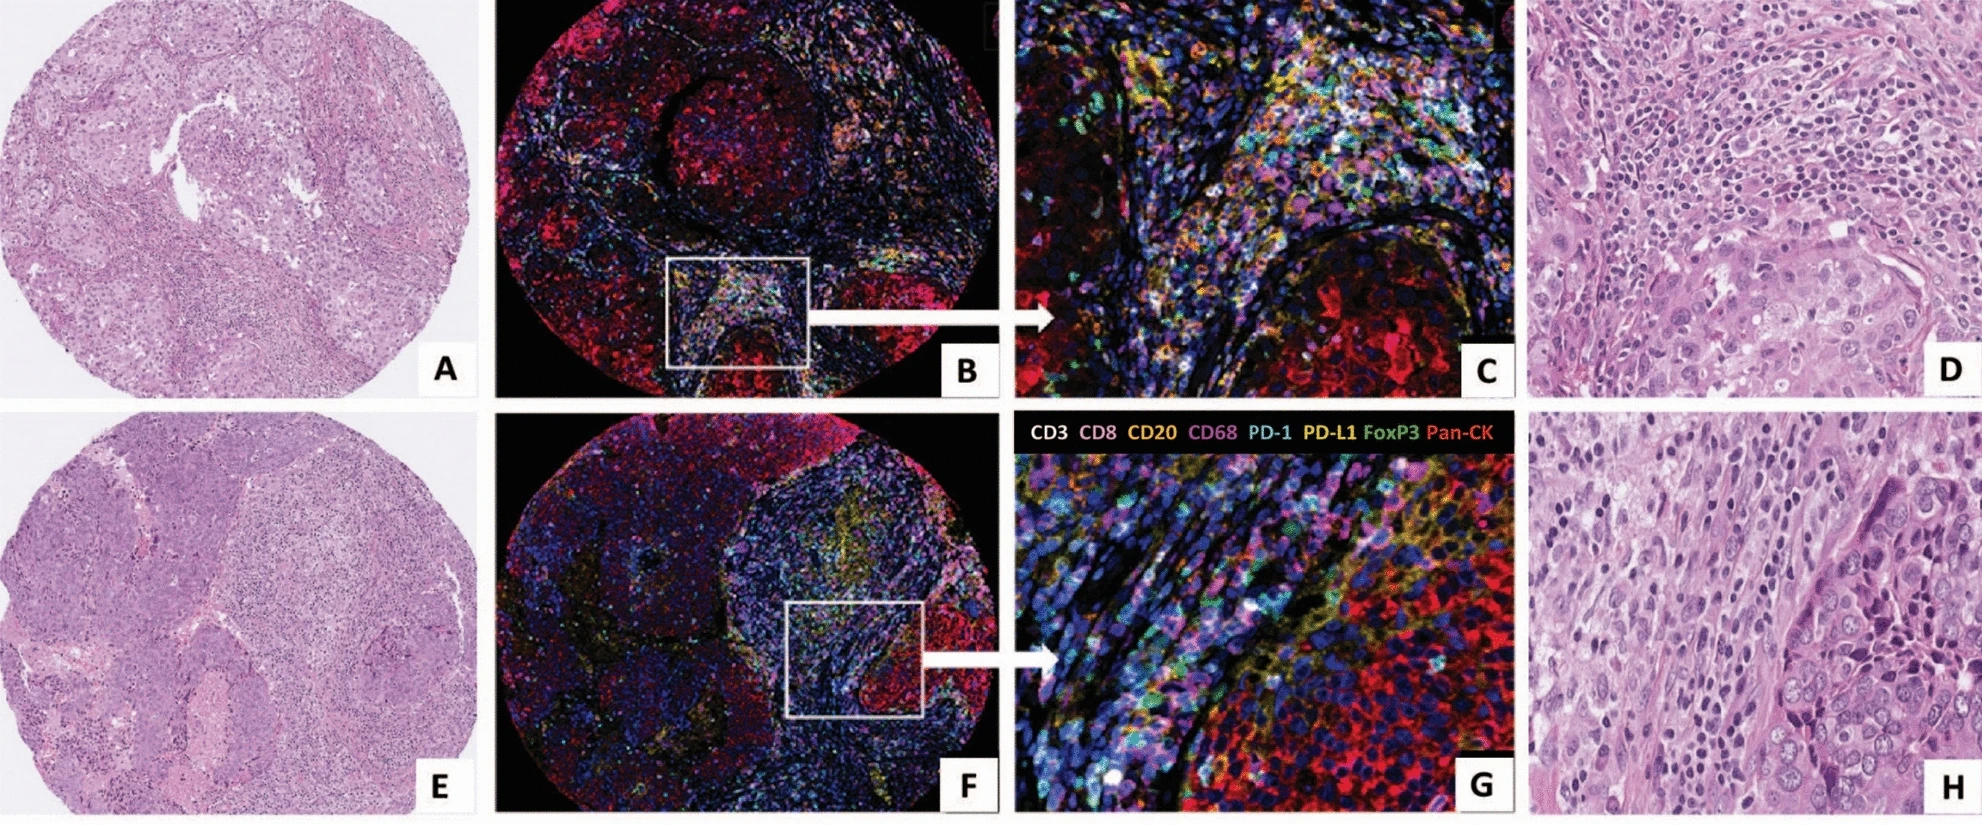
This figure contains tissue section images from two TNBC patients. H&E staining images are used to show the pathological morphological characteristics of tumor tissue, clarify the distribution of tumor cells and stromal regions, and provide a reference for the regional localization of subsequent multiplex immunofluorescence images. For example, the macroscopic characteristics of tumor cell nests and immune cell infiltration in the surrounding stroma can be observed, providing a pathological background for interpreting the distribution position of immune cells in multiplex immunofluorescence.
The multiplex immunofluorescence images use an 8-color fluorescence labeling system. Low-magnification images can observe the distribution pattern of various immune cells in the tumor stroma as a whole, while high-magnification images clearly show the colocalization of different markers. For example, the overlapping area of purple (CD68) and yellow (PD-L1) signals is CD68⁺PD-L1⁺ macrophages, and the red (Pan-CK) signal area clearly excludes tumor cell interference, ensuring that counting is only for immune cells in the stromal region. It intuitively verifies the effectiveness of TSA technology, which can clearly distinguish 8 markers on the same slice without obvious spectral interference. At the same time, through signal colocalization under high magnification, it proves the objective existence of composite phenotype cells such as CD68⁺PD-L1⁺.
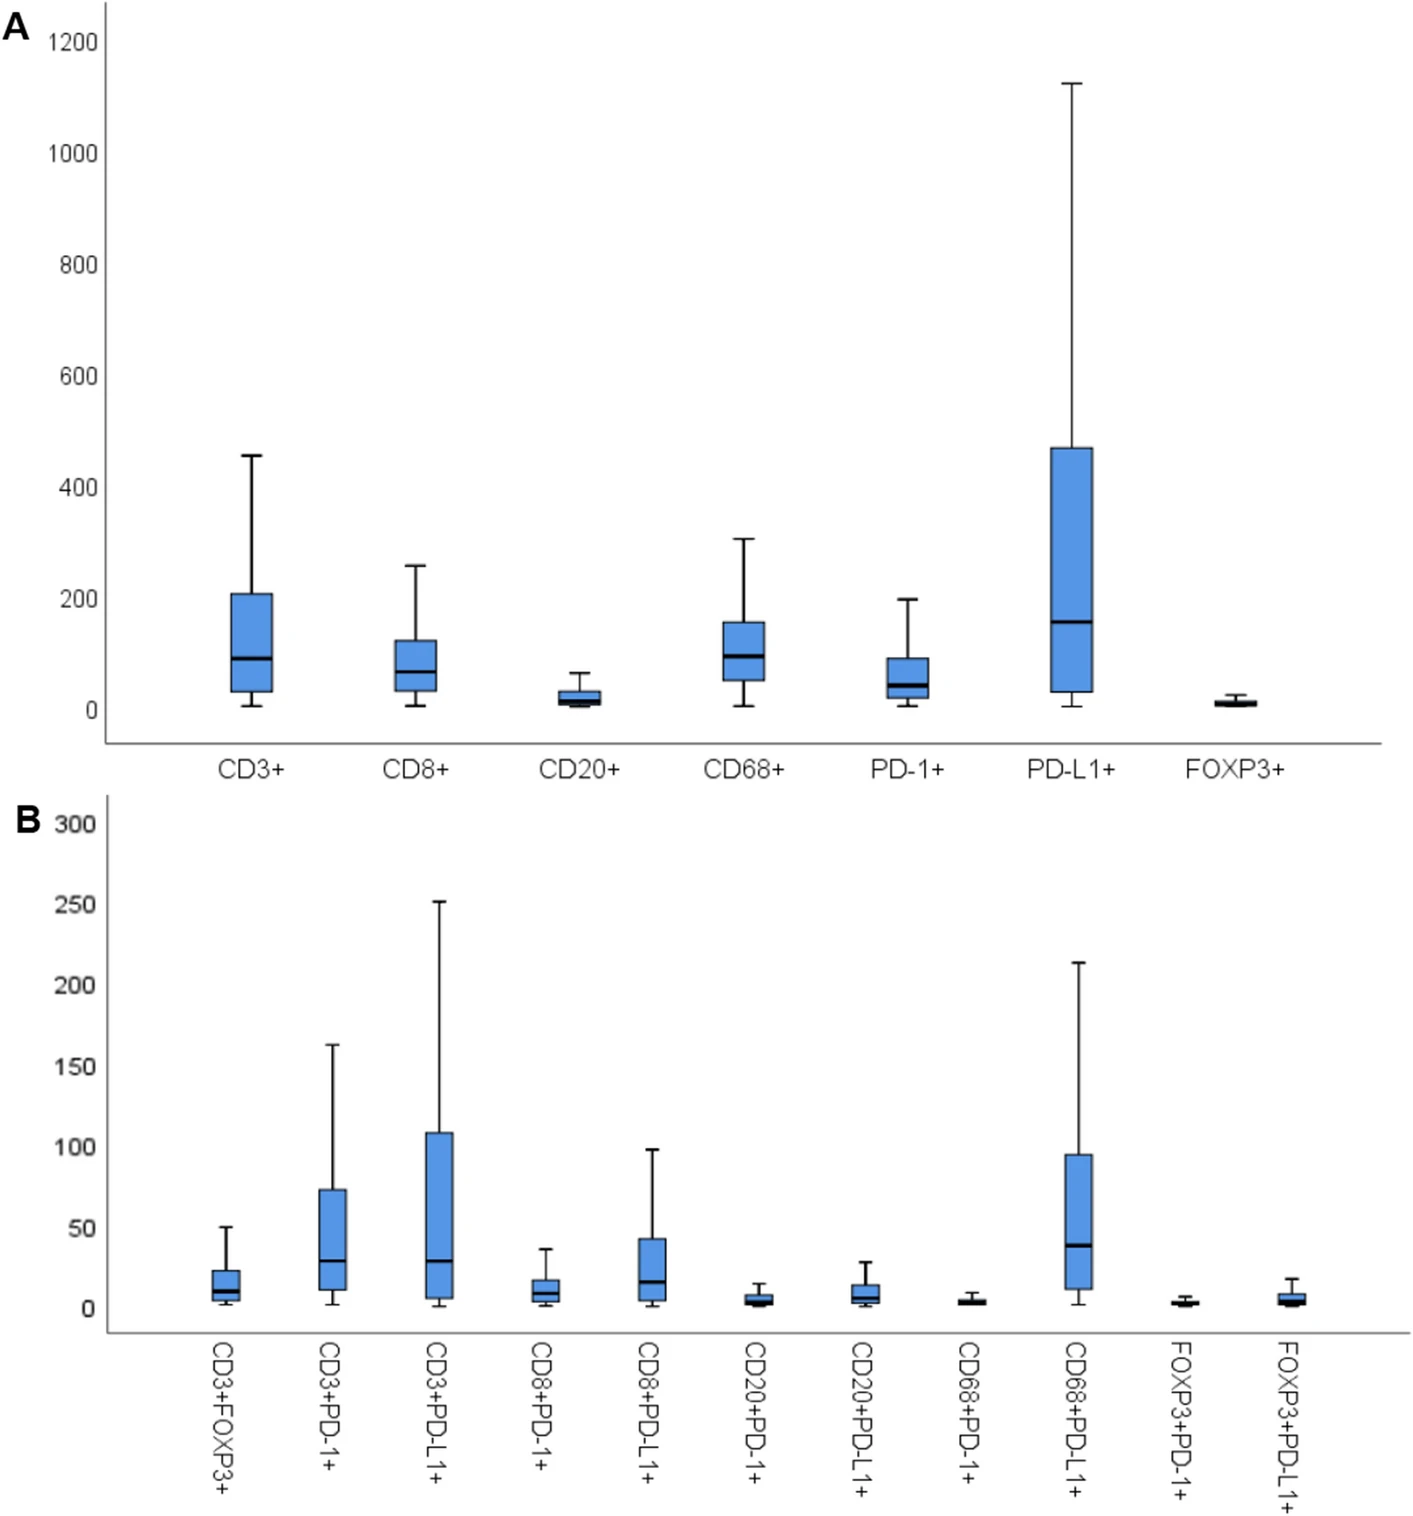
The boxplots present the density distribution of different immune phenotypes. Figure A focuses on single marker positive cells such as CD3⁺ and CD8⁺, clarifying the baseline quantitative characteristics of each cell type, among which PD-L1⁺ cells have the highest median density and FOXP3⁺ cells have the lowest. Figure B extends to 11 dual-marker positive cells, focusing on the density of the core CD68⁺PD-L1⁺ phenotype, while determining high/low expression grouping criteria based on the median. The subsequent patient survival analysis in the study was carried out based on this quantitative grouping, closely linking phenotype data with clinical prognosis analysis.
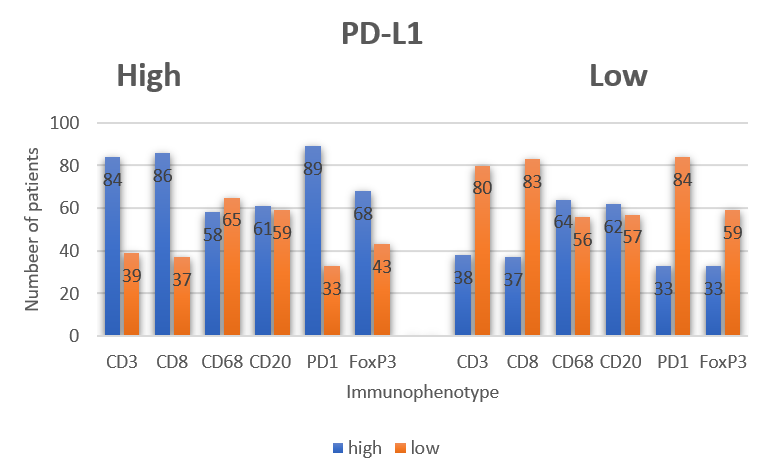
Based on multiplex immunofluorescence staining data, the bar chart statistics the proportion of PD-L1⁺ cells in different immune phenotypes, such as the proportion of CD68⁺PD-L1⁺ to total CD68⁺ cells, and the proportion of CD3⁺PD-L1⁺ to total CD3⁺ cells. Through proportion analysis, it excludes the interference of cell total differences, accurately identifying that PD-L1 has a higher co-expression proportion in macrophages. This finding directly takes CD68⁺PD-L1⁺ macrophages as the core research object, making phenotype screening more targeted.
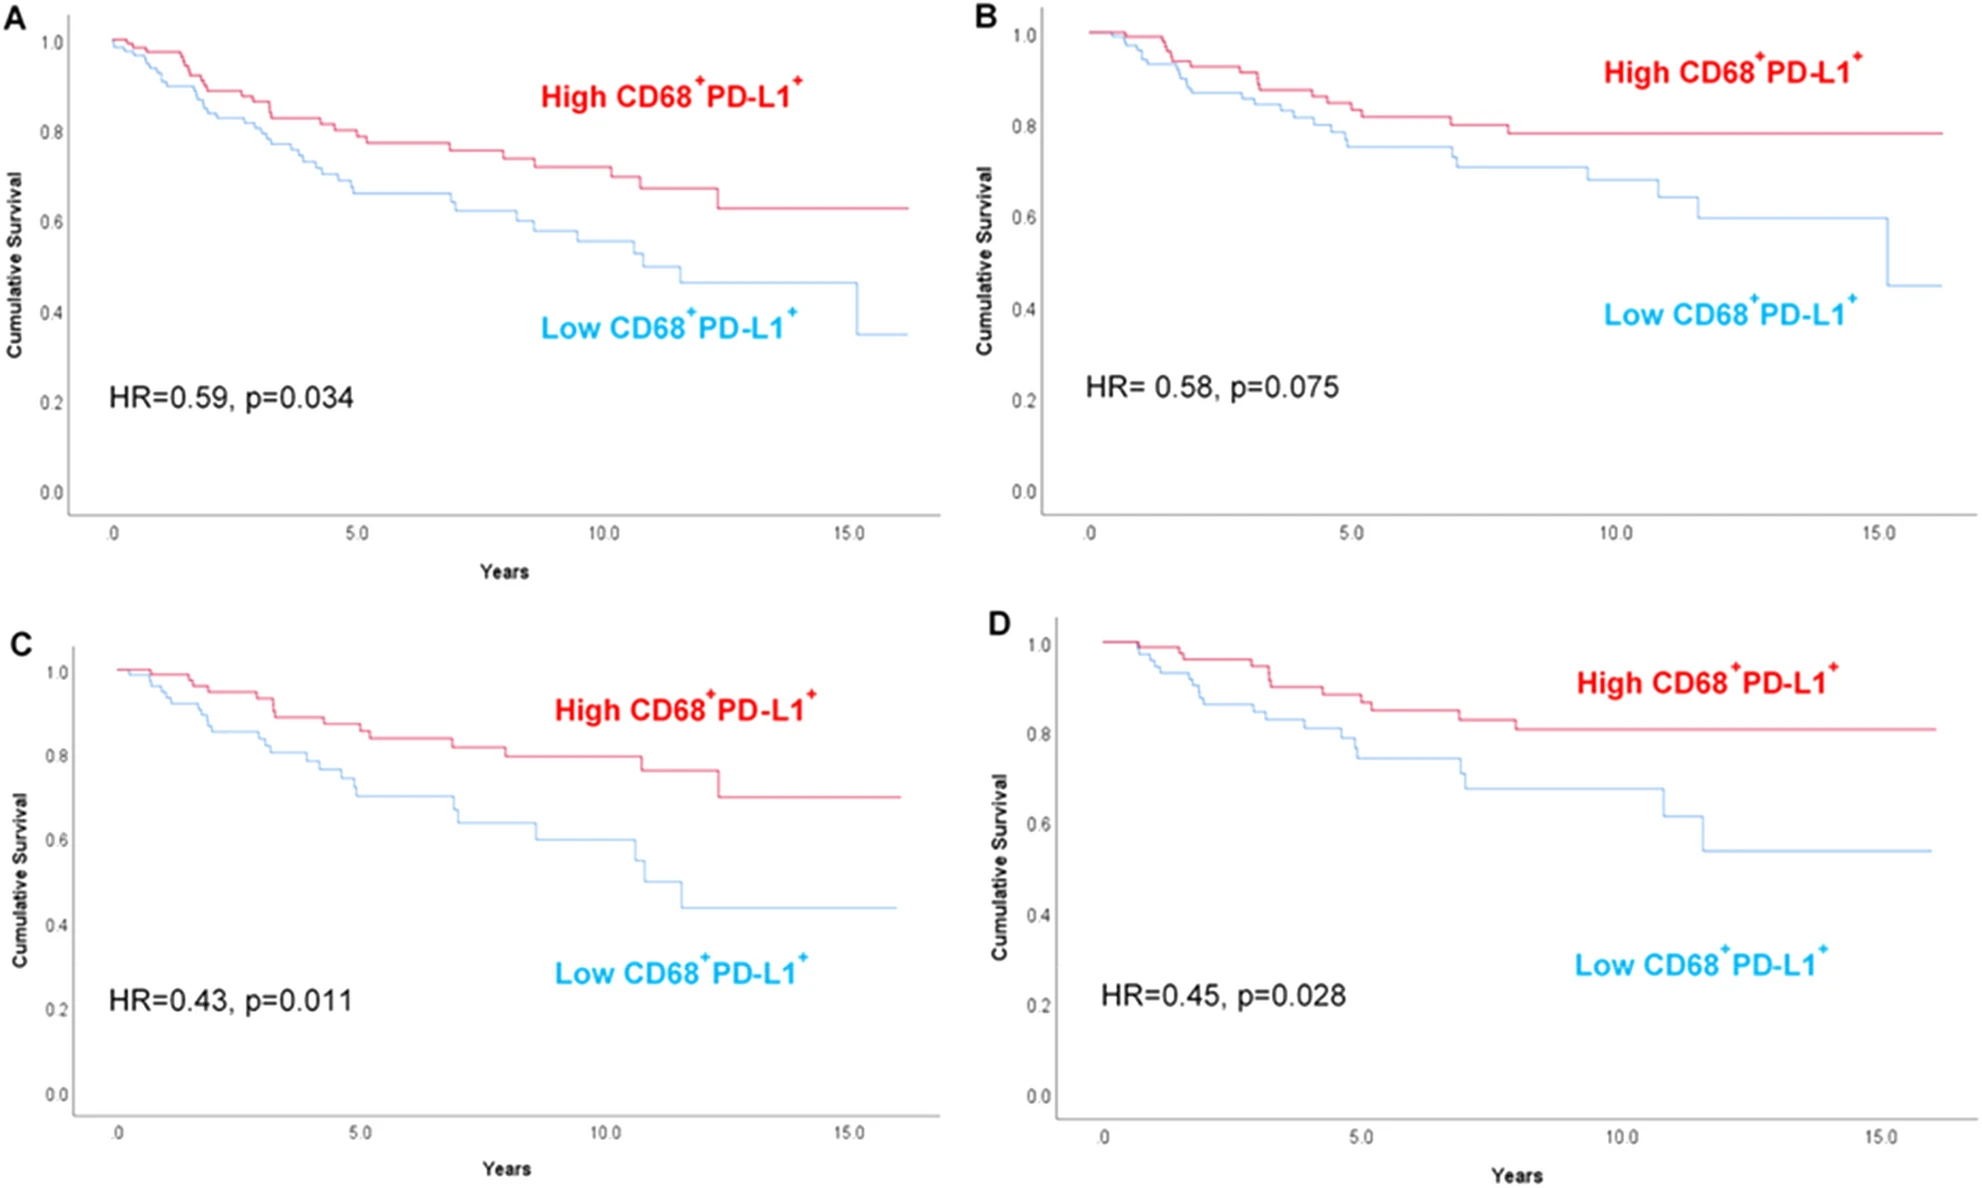
Based on the precise counting and stratification of CD68⁺PD-L1⁺ macrophages using TSA multiplex immunofluorescence technology, Kaplan-Meier survival curves were generated, divided into four subplots according to overall patients-chemotherapy patients and overall survival-breast cancer-specific survival. Each curve was divided into two groups based on high CD68⁺PD-L1⁺ and low CD68⁺PD-L1⁺, and the degree of curve separation directly reflects the prognosis difference. For example, in the overall survival analysis of all patients (Figure A), the high expression group curve is always above the low expression group, and the difference is statistically significant (HR=0.59, p=0.034). In patients receiving chemotherapy (Figures C and D), the separation of the two groups' curves is more obvious, proving that this phenotype has stronger prognostic predictive value in the chemotherapy population.
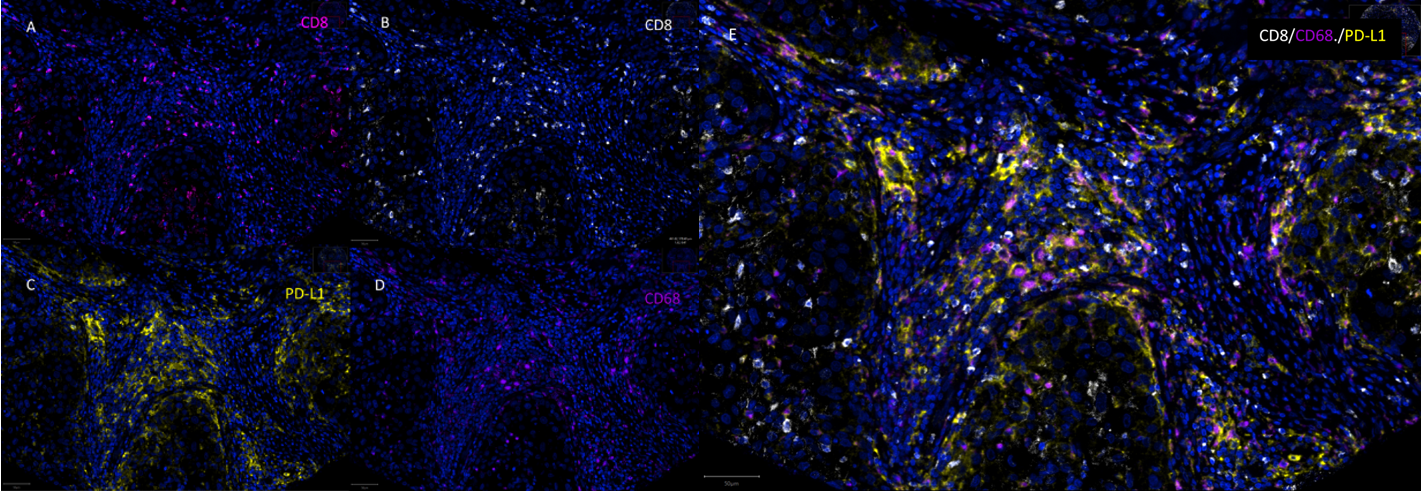
This figure focuses on the three key markers in the study: CD8, CD68, and PD-L1, presenting single-channel fluorescence images and three-channel merged images for each marker. Single-channel images can effectively exclude spectral overlap interference between different fluorescences, ensuring signal specificity. Merged images can clearly show the colocalization details of CD8⁺PD-L1⁺ and CD68⁺PD-L1⁺, especially clarifying the signal overlap area between CD68 and PD-L1, further verifying the accuracy of multiplex immunofluorescence signals and providing more detailed image evidence for the identification of core phenotypes.
Summary
This study, using a multiplex immunofluorescence method with TSA technology as the core, successfully revealed the prognostic value of CD68⁺PD-L1⁺ macrophages in TNBC, providing a new direction for precise diagnosis and treatment of this disease. The study fully embodies the core advantages of TSA technology: through multi-marker colocalization, it achieves fine analysis of immune cell phenotypes, solving the complex microenvironment research needs that traditional IHC cannot handle. At the same time, the study also provides a reference paradigm for the clinical application of TSA technology - from antibody combination optimization, standardized staining procedures to quantitative analysis methods, all providing reproducible technical solutions for subsequent research. In the future, with the deep integration of TSA technology and artificial intelligence image analysis, its application in tumor immune typing, treatment response prediction, and other fields will become more widespread.
References
Wang J, Browne L, Slapetova I, Shang F, Lee K, Lynch J, Beretov J, Whan R, Graham PH, Millar EKA. Multiplexed immunofluorescence identifies high stromal CD68+PD-L1+ macrophages as a predictor of improved survival in triple negative breast cancer. Sci Rep. 2021 Nov 3;11(1):21608. doi: 10.1038/s41598-021-01116-6. PMID: 34732817; PMCID: PMC8566595.
EnkiLife mIHC TSA Kits
Product | Catalog Number |
|---|---|
TSA Six-Label Seven-Color Multiplex Immunohistochemistry Kit | |
TSA Five-Label Six-Color Multiplex Immunohistochemistry Kit | |
TSA Four-Label Five-Color Multiplex Immunohistochemistry Kit | |
TSA Three-Label Four-Color Multiplex Immunohistochemistry Kit | |
TSA Two-Label Three-Color Multiplex Immunohistochemistry Kit |