
mIF/mIHC Image Analysis: Mining In‑situ Tissue Immune Information
Different from traditional immunohistochemistry which can only detect a single protein marker, multiplex fluorescence immunohistochemistry enables simultaneous labeling of multiple biomarkers on a single tissue section. It fully preserves authentic information including in‑situ tissue architecture, cellular locations and cell‑cell interactions, providing critical technical support for tumor microenvironment dissection, discovery of novel therapeutic targets and optimization of immunotherapy regimens.
Nevertheless, high‑quality multiplex fluorescence sections are merely research "raw materials". Accurate and comprehensive image analysis is the core to unlock data value. Manual visual evaluation cannot precisely quantify complex multi‑channel fluorescent signals, nor capture deep micro‑level information such as cellular spatial distribution and cell‑cell crosstalk. Simply put, without professional software interpretation, multiplex immunofluorescence images are equivalent to a treasure trove without mining tools, where massive valid information remains buried. Professional image‑analysis software bridges the gap from qualitative visual observation to precise quantification and multi‑dimensional spatial interpretation, unlocking the full research potential of pathological images.
I. Precise Quantification: Single‑Cell‑Level Evaluation of Biomarker Expression
Precise quantification represents the most fundamental and core capability of multiplex fluorescence image analysis, applicable to both conventional IHC and multiplex immunofluorescence quantitative studies. Conventional manual scoring can only roughly distinguish positive‑negative cellular status with prominent subjectivity and poor reproducibility. Standardized image‑analysis workflows realize standardized quantification for cell identification, positive‑cell determination and graded scoring.
Leveraging modern image‑segmentation algorithms and deep‑learning recognition, full‑field‑of‑view cell contour detection and segmentation can be performed on pathological images. For tumor tissues with variable cell density and morphology, general pre‑trained models support batch cell segmentation; watershed algorithms can further fine‑tune segmentation parameters to delineate cell boundaries for challenging tissue samples. Positive cells are identified according to signal characteristics across fluorescence channels. Positive expression is further graded as 1+, 2+ and 3+ based on fluorescence intensity, complying with standard research and pathological scoring criteria.
The quantitative workflow generates standardized experimental outputs including positive‑cell ratio, H‑score and raw single‑cell quantitative metrics. These outputs satisfy statistical requirements and guarantee traceability and reproducibility of experimental data.
II. In‑situ Phenotyping: Deciphering Cellular Diversity and Discovering Novel Cell Subsets
In‑situ cellular phenotyping dissects the heterogeneous cellular composition within the tumor immune microenvironment. Based on multi‑marker co‑expression patterns, single‑cell‑resolution in‑situ cell typing and atlas profiling are achieved. Two major analytical dimensions are included. First, known cell‑subset identification: classic marker combinations are applied to functionally characterize immune and stromal cells, such as regulatory T cells (CD3+CD4+FOXP3+) and double‑negative T cells (CD3+CD4‑CD8‑), outlining the cellular landscape of the microenvironment. Second, unbiased discovery of unknown cellular phenotypes: systematic profiling of all marker co‑positive and co‑negative patterns enables screening for potential novel cell subsets without prior cell‑type assumptions. This approach is widely used to characterize tumor microenvironment heterogeneity, evaluate in‑situ immune responses, screen prognostic and therapeutic targets, and dissect microcellular mechanisms governing tumor progression and immune escape.
For a typical 6‑plex 7‑color multiplex immunofluorescence section, approximately 50 cellular phenotypes can be resolved solely from co‑positive marker combinations; over 100 cell subsets can be detected when incorporating co‑negative profiles, greatly overcoming limitations of empirical manual cell classification. This comprehensive phenotyping workflow supports diverse research scenarios: novel phenotype mining, in‑situ immune‑response assessment, therapeutic‑target screening, spatial cell‑interaction exploration, novel biomarker discovery and panoramic tumor‑immune‑microenvironment profiling. It serves as a vital analytical tool for tumor‑immunity mechanistic research.
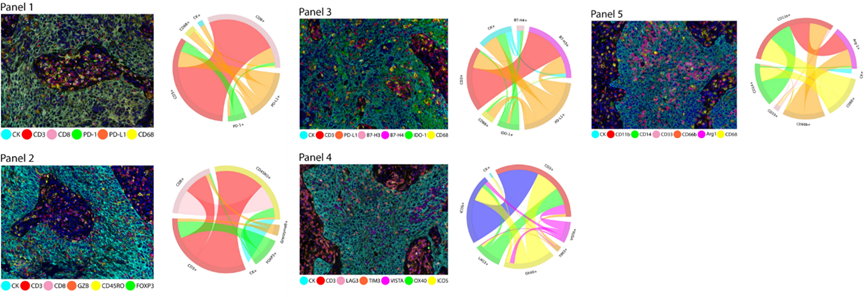
Multiplex immunofluorescence images and marker co‑expression connectivity diagrams of different immuno‑oncology panels from non‑small‑cell lung cancer tissue sections, demonstrating cellular phenotypic diversity.
III. Tissue Region Segmentation: Dissecting Functional Heterogeneity Across Microenvironmental Zones
Distinct cellular functions are observed across different tissue compartments. Immune‑cell distribution and infiltration patterns in tumor parenchyma and stroma directly regulate tumor progression and therapeutic outcomes, rendering compartment‑specific quantification indispensable for research.
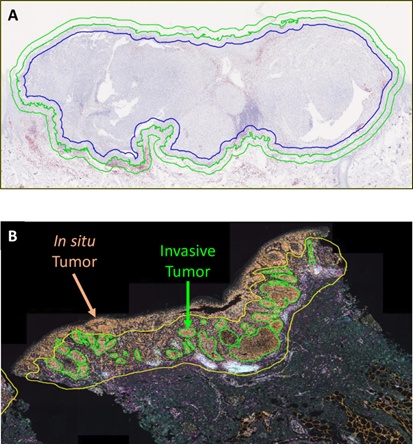
Deep‑learning models trained on large‑scale fluorescence‑pathology datasets reliably distinguish tumor parenchyma and tumor stroma, supporting both single‑sample analysis and standardized batch processing of large cohorts. For pathologically unique or unevenly‑stained samples, manual annotation can further refine recognition rules and improve segmentation accuracy for diverse experimental scenarios.
Segmentation outputs are integrated with cellular quantification and spatial profiling. Metrics including cell count, positive‑cell fraction and cell density are computed for tumor regions, stromal compartments and whole sections, revealing spatial distribution disparities of cell subsets across microenvironmental niches. These outputs provide fundamental data for investigating tumor‑microenvironment spatial heterogeneity, tumor‑infiltration patterns and immune‑escape mechanisms.
IV. Multi‑Dimensional Spatial Analysis: Decoding In‑situ Cellular Distribution and Interaction Patterns
A key advantage of multiplex immunofluorescence is full retention of native in‑situ spatial tissue information. Spatial‑feature interpretation unlocks core value hidden within such datasets. Spatial coordinates are assigned to every single cell on sections to systematically characterize distribution patterns, infiltration features and cell‑to‑cell interactions of distinct cell subsets, compensating for conventional counting statistics which prioritize cell abundance while neglecting spatial positioning.
1. Tumor Immune Infiltration Analysis
This analysis quantifies tumor‑immune‑infiltration profiles. Gradient distance bins are defined relative to tumor boundaries to quantify target immune‑cell abundance at varying distances. Metrics including mean distance from cells to tumor boundary and cell density within each bin are calculated and visualized, enabling direct comparison of immune‑cell infiltration between intra‑tumoral and stromal compartments. For instance, profiling T‑cell distribution within a 200 μm radius of tumor regions objectively evaluates immune‑infiltration magnitude and provides quantitative evidence for immune‑status assessment and therapeutic‑response prediction.
2. Cellular Neighboring and Nearest‑Distance Analysis
Spatial association analysis explores in‑situ interaction modes among microenvironmental cell populations via two strategies. First, concentric‑ring neighboring analysis: varying radial distances are set to count neighboring cells surrounding target populations and quantify cell abundance stratified by distance. Second, nearest‑distance analysis: minimal and average pairwise distances between two cell populations are measured to estimate physical contact probability and interaction potential. This workflow is frequently applied to study spatial adjacency between tumor cells and cytotoxic T‑cells, macrophages and other immune populations, assisting mechanistic interpretation of immune activation or immune suppression within tumors.
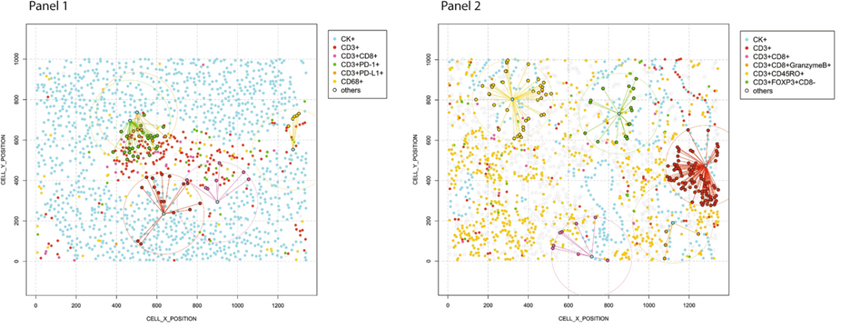
Distance relationships between CK+ malignant cells, diverse CD3+ T‑cell phenotypes (color‑coded according to marker profiles), and CD68+ macrophages.
V. Special‑Scenario Adaptation: Tissue Microarray (TMA) and Specialized‑Structure Analysis
1. Batch Analysis of Tissue Microarrays (TMA)
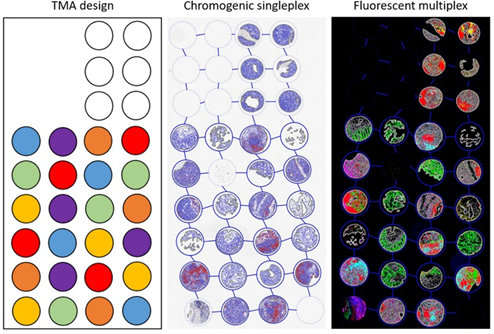
Tissue microarrays serve as critical experimental platforms for large‑cohort studies. Standardized segmentation isolates individual tissue cores on TMA slides for independent cellular quantification, phenotyping and spatial‑feature analysis. Unified analytical pipelines substantially boost efficiency and consistency for large clinical cohorts, supporting mechanistic investigation and biomarker screening using abundant clinical specimens.
2. Tertiary Lymphoid Structure (TLS) Identification
Tertiary lymphoid structures represent research‑worthy specialized immune compartments in tumor microenvironments. Their presence, abundance and spatial distribution correlate strongly with patient prognosis and immunotherapy efficacy. Leveraging combinatorial multiplex‑marker signatures, TLS can be accurately detected on sections. Researchers quantify TLS number and distribution, further dissect immune‑cell composition and spatial arrangement inside TLS to elucidate their mechanistic roles in tumor immune regulation.
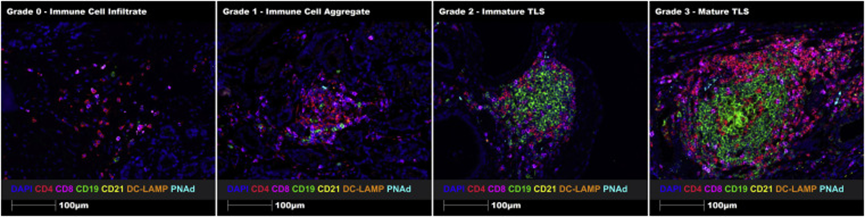
To establish a TLS maturation‑grading system, comparative images of TLS across distinct regions from human prostate‑cancer FFPE sections are presented: immune‑cell infiltration (Grade 0), immune‑cell aggregation (Grade 1), immature TLS (Grade 2), and mature TLS (Grade 3). Unified staining and imaging parameters enable objective and quantitative grading criteria.
VI. Image Registration and Fusion: Overcoming Limitations of Biomarker Detection Throughput
Restricted by fluorescence‑spectral overlap and single‑section staining capacity, only a limited number of protein biomarkers can be detected per slide, which cannot satisfy high‑dimensional multi‑target microenvironment research demands. Slide registration and image‑fusion technologies break such experimental bottlenecks and greatly expand detection dimensionality for individual samples.
On one hand, serial sections from identical specimens stained with distinct marker panels can be precisely registered and fused. For example, information merged from two serial sections carrying separate marker sets generates virtual high‑plex multi‑color composite images and enables cross‑section spatial‑cell‑association analysis, vastly enriching research dimensionality for each specimen.
On the other hand, this workflow upgrades conventional IHC data. Bright‑field IHC images are converted into pseudo‑fluorescence representations. Multiple serial IHC slides are fused to achieve multi‑target integration and spatial profiling from traditional single‑plex IHC data. Conventional IHC datasets are no longer confined to simple positive‑rate statistics but can be further exploited for cellular spatial‑distribution and microenvironment‑interaction studies, maximizing research value of legacy experimental data.
Summary
Ranging from basic cellular quantitative scoring and single‑cell phenotyping, tissue‑compartment segmentation, multi‑dimensional spatial‑interaction analysis, to TMA batch processing, TLS identification and multi‑slide image‑fusion workflows, professional multiplex‑immunofluorescence image‑analysis software delivers an end‑to‑end, standardized and high‑precision pathological‑image analytical framework.
This technology eliminates subjectivity and limitations of manual evaluation, transforming pathological‑image interpretation from qualitative observation toward precise quantification and multi‑dimensional spatial decoding. It deeply uncovers cellular composition, distribution patterns and interaction mechanisms within tumor microenvironments, acting as an indispensable core technical pillar for tumor basic research, target discovery, immunotherapy optimization and biomarker development.
References
[1] Parra ER, Ferrufino‑Schmidt MC, Tamegnon A, Zhang J, Solis L, Jiang M, Ibarguen H, Haymaker C, Lee JJ, Bernatchez C, Wistuba II. Immuno‑profiling and cellular spatial analysis using five immune oncology multiplex immunofluorescence panels for paraffin tumor tissue. Sci Rep. 2021 Apr 19;11(1):8511. doi: 10.1038/s41598‑021‑88156‑0. PMID: 33875760; PMCID: PMC8055659.
[2] Taube JM, Sunshine JC, Angelo M, Akturk G, Eminizer M, Engle LL, Ferreira CS, Gnjatic S, Green B, Greenbaum S, Greenwald NF, Hedvat CV, Hollmann TJ, Jiménez‑Sánchez D, Korski K, Lako A, Parra ER, Rebelatto MC, Rimm DL, Rodig SJ, Rodriguez‑Canales J, Roskes JS, Schalper KA, Schenck E, Steele KE, Surace MJ, Szalay AS, Tetzlaff MT, Wistuba II, Yearley JH, Bifulco CB. Society for Immunotherapy of Cancer: updates and best practices for multiplex immunohistochemistry (IHC) and immunofluorescence (IF) image analysis and data sharing. J Immunother Cancer. 2025 Jan 8;13(1):e008875. doi: 10.1136/jitc‑2024‑008875. PMID: 39779210; PMCID: PMC11749220.
[3] Parra ER, Ferrufino‑Schmidt MC, Tamegnon A, Zhang J, Solis L, Jiang M, Ibarguen H, Haymaker C, Lee JJ, Bernatchez C, Wistuba II. Immuno‑profiling and cellular spatial analysis using five immune oncology multiplex immunofluorescence panels for paraffin tumor tissue. Sci Rep. 2021 Apr 19;11(1):8511. doi: 10.1038/s41598‑021‑88156‑0. PMID: 33875760; PMCID: PMC8055659.
[4] Viratham Pulsawatdi A, Craig SG, Bingham V, McCombe K, Humphries MP, Senevirathne S, Richman SD, Quirke P, Campo L, Domingo E, Maughan TS, James JA, Salto‑Tellez M. A robust multiplex immunofluorescence and digital pathology workflow for the characterisation of the tumour immune microenvironment. Mol Oncol. 2020 Oct;14(10):2384‑2402. doi: 10.1002/1878‑0261.12764. Epub 2020 Sep 1. PMID: 32671911; PMCID: PMC7530793.
[5] Quigley LT, Pang L, Tavancheh E, Ernst M, Behren A, Huynh J, Da Gama Duarte J. Protocol for investigating tertiary lymphoid structures in human and murine fixed tissue sections using Opal™‑TSA multiplex immunohistochemistry. STAR Protoc. 2023 Mar 17;4(1):101961. doi: 10.1016/j.xpro.2022.101961. Epub 2023 Jan 10. PMID: 36633948; PMCID: PMC9843255.
EnkiLife mIHC TSA Kits
Product | Catalog Number |
|---|---|
7-Color Multiple Fluorescent Staining Kit (mIHC) | |
6-Color Multiple Fluorescent Staining Kit (mIHC) | |
5-Color Multiple Fluorescent Staining Kit (mIHC) | |
4-Color Multiple Fluorescent Staining Kit (mIHC) | |
3-Color Multiple Fluorescent Staining Kit (mIHC) |